Freshwater Runoff from Greenland
200 likes | 413 Vues
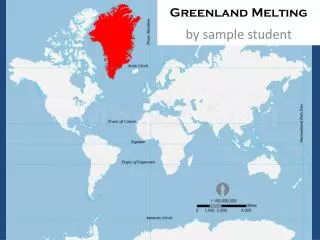
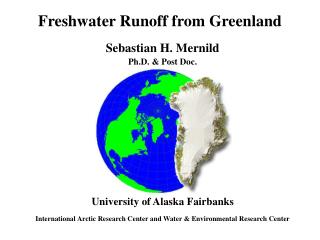
Freshwater Runoff from Greenland. Sebastian H. Mernild Ph.D. & Post Doc. University of Alaska Fairbanks International Arctic Research Center and Water & Environmental Research Center. Runoff from Greenland. Runoff from Greenland. Freshwater contribution from: GrIS (runoff and calving)

Freshwater Runoff from Greenland
E N D
Presentation Transcript
Freshwater Runoff from Greenland Sebastian H. Mernild Ph.D. & Post Doc. University of Alaska Fairbanks International Arctic Research Center and Water & Environmental Research Center
Runoff from Greenland • Freshwater contribution from: • GrIS • (runoff and calving) • Local glaciers • (runoff and claving) • Snow cover (runoff) • Net liquid precipitation (runoff).
D. Rumsfeld, former U.S. Secretary of Defense: “There are things we know. There are things we know we don’t know. There are things we don’t know we don’t know.”
D. Rumsfeld, former U.S. Secretary of Defense: “There are things we know. There are things we know we don’t know. There are things we don’t know we don’t know.” Related to runoff from Greenland
“There are things we know. Change surface air temperature, 1957-2006AnnualWinter
“There are things we know. • Increasing air precipitation 1% per decade, • More precipitation falls as rain, • Longer thawing season 2-3 weeks (since 1993) East Greenland, • Longer snow-free season 50-60 days (since 1993) East Greenland, • Negative local glacier net mass balance East Greenland.
“There are things we know we don’t know. There are things we don’t know we don’t know.” Runoff amount… Runoff variation (space and time)… Break-up time… Max discharge… Runoff contribution… . . . Therefore my Ph.D. and Post Doc.-study…
East Greenland catchments… High Arctic, Low precipitation, Low precentage of glacier cover. Low Arctic, High precipitation, Large precentage of glacier cover, Few MET and hydrometric data from East Greenland because of rough terrain, harsh climatic conditions, and remote locations. Only two areas are at present well documented in Met and hydrology: - Low Arctic Mittivakkat Glacier catchment, Sermilik, Ammassalik Island, SE Greenland. - High Arctic Zackenberg River catchment, NE Greenland.
Glacier mass balance and snow modeling by SnowModel: Spatial snow evolution: Snow accumulation, Snow distribution, Evaporation, Snow-blowing sublimation, Snow surface melt. Spatial Glacier melt: Glacier ice surface melt. SnowModel is used at Mittivakkat, Zackenberg, and GrIS. At the moment it is s a NON-glacier dynamic model – but in aumumn 2007 dynamic routines will be incorporated...
Example: Spatial SnowModel SWE Depth and Runoff at the Mittivakkat Glacier catchment End of Winter SWE Depth Yearly Runoff
SnowModel used on glaciers at Mittivakkat and Zackenberg Mittivakkat (65°N) (14 km2) Zackenberg (74°N) (101 km2) Period 1999-2004 1997-2005 P (mm w.eq. y-1)1,491 255 E + Su (mm w.eq. y-1)260* 115 ** R(mm w.eq. y-1)1,983 1,487 ΔS(mm w.eq. y-1) -616 -1,347 ΔSOBS(mm w.eq. y-1) -600 ------ * Approximately 12% of solid precipitation was returned to the atmosphere. ** Approximately 18% of solid precipitation was returned to the atmosphere.
Runoffmodeling: Time-Area method with SnowModel (hourly time step), NAM, lumped conceptual model with degree-day (daily time step), MIKE-SHE, spatial distributed model with SnowModel (daily time step).
Comparison of average freshwater runoff from Mittivakkat and Zackenberg Mittivakkat (65°N) Zackenberg (74°N) Period 1993-2004 1997-2005 Catchment area (km2) 18.4 512 Glacier cover (%)78 20 Average SIM runoff (mm w.eq. y-1) 1,975 428 Average SIM runoff (m3 y-1) ~37×106~219×106 Annual specific SIM runoff (l s-1 km-2) ~63 ~14 Glacier contribution of total SIM yearly runoff (%)~ 90 – 95 ~ 50 – 90
Runoff from the entire Greenland Iceberg calving ??? km3 per year Local glaciers/ice sheets ??? km3 per year Greenland Ice Sheet ??? km3 per year Net precipitation ??? km3 per year Total: ??? km3 per year
Mass balance and runoff from GrIS MET data from DMI and the Koni Steffen Groupe At CU, Boulder (1996-2005) SnowModel 2002
Mass balance and runoff from GrIS GrIS extent non-summer surface melt (GrIS interior) GrIS extent non-summer surface melt (GrIS interior) 2002
East Greenland 1999-2004 Iceberg calving 116 km3 per year (Literature studies) Local glaciers/ice sheets 13 km3 per year (satellite pic’s/map of glacier cover and SnowModel) East GrIS 141 km3 per year (SnowModel) (missing: routing the water to the margin) Net liquid precipitation 168 km3 per year (SnowMode/MicroMet) Total: ~440 km3 per year (equals ~10% of the total freshwater input from the Arctic Ocean to the Greenland Sea)
Present work… GrIS mass balance and runoff (1950-2080) (SnowModel) DMI-data (HIRHAM 4, 25 km2) (CSU and CU), GrIS mass balance and runoff (1996-2006) (SnowModel) NARR-data Compare to DMI and Koni Steffen-data (CSU and CU) - Routines for glacier dynamic and runoff routing (SnowModel) (CU) Routines for temperature inversion (SnowModel) (Mittivakkat and Zackenberg) (CSU and UC)
The End Thanks…!!!