Hypothesis Testing Procedures
Explore the various types of data including nominal, ordinal, discrete, and continuous for hypothesis testing procedures. Understand the distinctions between parametric and non-parametric tests to analyze data effectively.

Hypothesis Testing Procedures
E N D
Presentation Transcript
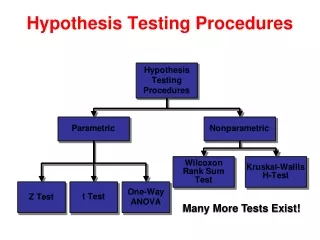
Hypothesis Testing Procedures Many More Tests Exist!
Types of Data and Analysis Nominal Ordinal Discrete Continuous Non-parametric Parametric
Types of Data Nominal: No numerical value Ordinal: Order or rank Discrete: Counts Continuous: Interval, ratio
Nominal Data • Non numerical value • Blood grouping: A, B, AB, O • Grades in PHL 541:A+ • Urates in urine: ++, +++, +
Ordinal Data Items on an ordinal scale are set into some kind of order by their position on the scale. This may indicate such as temporal position, superiority, etc. The order of items is often defined by assigning numbers to them to show their relative position. Letters or other sequential symbols may also be used as appropriate. You cannot do arithmetic with ordinal numbers -- they show sequence only. Example • The first, third and fifth person in a race. • Pay bands in an organization, as denoted by A, B, C and D.
Discrete Data • A type of data is discrete if there are only a finite number of values possible or if there is a space on • the number line between each 2 possible values. • Exmple. A 5 question quiz is given in PHL 541 class. The number of correct answers on a student's quiz is an example of discrete data. The number of correct answers would have to be one of the following : 0, 1, 2, 3, 4, or 5. There are not an infinite number of values, therefore this data is discrete. Also, if we were to draw a number line and place each possible value on it, we would see a space between each pair of values. • Exmple. In order to obtain a taxi license in Riyadh, a person must pass a written exam regarding different locations in the city. How many times it would take a person to pass this test is also an example of discrete data. A person could take it once, or twice, or 3 times, or 4 times, or… . So, the possible values are 1, 2, 3, … . There are infinitely many possible values, but if we were to put them on a number line, we would see a space between each pair of values. • Discrete data usually occurs in a case where there are only a certain number of values, or when we are counting something (using whole numbers).
Continuous Data • Continuous data makes up the rest of numerical data. This is a type of data that is usually associated with some sort of physical measurement. • Example. The height of trees at a nursery is an example of continuous data. Is it possible for a tree to be 76.2" tall? Sure. How about 76.29"? Yes. How about 76.2914563782"? Yes. • One general way to tell if data is continuous is to ask yourself if it is possible for the data to take on values that are fractions or decimals. If your answer is yes, this is usually continuous data. • Example. The length of time it takes for a light bulb to burn out is an example of continuous data. Could it take 800 hours? How about 800.7? 800.7354? The answer to all 3 is yes
Classify each set of data as discrete or continuous. 1) The number of suitcases lost by an airline. 2) The height of corn plants. 3) The number of ears of corn produced. 5) The time it takes for a car battery to die. 6) The production of tomatoes by weight.
Answers 1) Discrete: The number of suitcases lost must be a whole number. 2) Continuous: The height of corn plants can take on infinitely many values (any decimal is possible). 3) Discrete: The number of ears of corn must be a whole number. 4) Continuous: The amount of time can take on infinitely many values (any decimal is possible). 5) Continuous: The weight of the tomatoes can take on infinitely many values (any decimal is possible).
What is a parameter and why should I care? Most statistical tests, like the t test, assume some kind of underlying distribution, like the normal distribution If you know the mean and the standard deviation of a normal distribution then you know how to calculate probabilities Means and standard deviations are called Parameters; all theoretical distributions have parameters. Statistical tests that assume a distribution and use parameters are called parametric tests Statistical tests that don't assume a distribution or use parameters are called non-parametric tests
Parametric Test Procedures 1- Involve Population Parameters Example: Population Mean 2- Require Interval Scale or Ratio Scale Whole Numbers or Fractions Example: Height in Inches (72, 60.5, 54.7) 3- Have Stringent Assumptions Example: Normal Distribution
Nonparametric Test Procedures A nonparametric test is a hypothesis test that does not require any specific conditions about the shape of the populations or the value of any population parameters. Tests are often called“distribution free”tests.
Why non-parametric statistics? Need to analyse ‘Crude’ data (nominal, -ordinal) Data derived from small samples Data that do not follow a normal distribution Data of unknown distribution
Wilcoxon rank sum test (or the Mann-Whitney U test) In statistics, the Mann-Whitney U test (also called the Mann-Whitney-Wilcoxon (MWW), Wilcoxon rank-sum test, or Wilcoxon-Mann-Whitney test) is a non-parametric test for assessing whether two samples of observations come from the same distribution. It requires the two samples to be, independent and the observations to be ordinal or continuous measurements, i.e. one can at least say, of any two observations, which is the greater.
It is one of the best-known non-parametric significance tests. It was proposed initially by Wilcoxon (1945), for equal sample sizes, and extended to arbitrary sample sizes and in other ways by Mann andWhitne(1947). MWW is virtually identical in performing an ordinary parametric two-sample ttest on the data after ranking over the combined samples.
As the one-way ANOVA is an extension of the two independent groups t-test, The Kruskal-Wallis test is an extension of the Mann-W hitney U test. The Kruskal-Wallis test handles k-independent groups of samples. Like the Mann-Whiteny U test, this test uses ranks.
Chisquare Comparisons between proportions or percentages Research questions about two or more separate or independent groups Research questions about two dependent or correlated groups