Download

1 / 16
160 likes | 296 Vues
Changes of Seasonally Frozen Ground from 1967 to 1997 in Qinghai-Tibetan Plateau. Lin Zhao Cold and Arid Regions Environmental and Engineering Research Institute, Chinese Academy of Sciences. Contents. Introduction Data Sources and Methods

E N D
Changes of Seasonally Frozen Ground from 1967 to 1997 in Qinghai-Tibetan Plateau Lin Zhao Cold and Arid Regions Environmental and Engineering Research Institute, Chinese Academy of Sciences
Contents • Introduction • Data Sources and Methods • Climate and SFG Thickness Changes in Different Regions • Changes of freezing duration • Changes of ground surface temperatures
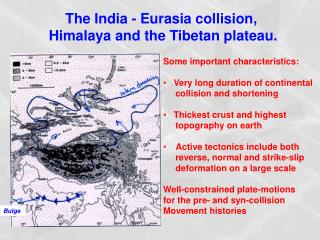
INTRODUCTION • Study area • SFG distribution • Climate warming
AT Fluctuation in QTP and Northern Hemisphere in 20th Century QTP (Liu, et al., 1998) Northern Hemisphere (Jones and Briffa, 1992)
DATA SOURCES AND METHODS • Data selection • Data used: AT, Precipitation, SFG thickness, GST • Stations selection • Data processing • Missing data • Data standardizing • Different unit, value and changing amplitude • Hierarchical Cluster Analysis
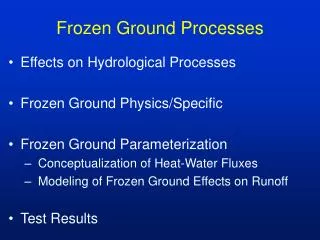
DATA SOURCES AND METHODS • Missing data • Temperatures • Freezing depths • Freezing duration
Climate and SFG Thickness Changes in Different Regions • To identify the differences of SFG changes in different geographic regions • Criterion used for cluster classification • Geo-location: Latitude, Longitude, elevation • Main climatic factors: MAAT and MAP
Elevation: 1500~3500 m MAAT: 0.8~8˚C (mean: 4.1) AP: 16~360 mm (mean: 194) MAWAT:-0.5~-7.2 ˚C (mean: -4.2) SFG: 80~220 cm (mean: 127.8) Distribution of Different Clusters Classified based on Location and Main Climatic Factors Elevation: 800~1500 m MAAT: 10~12˚C (mean: 11.4) AP: 20~60 mm (mean: 38) MAWAT:-2~3.0 ˚C (mean: 1.5) SFG: 40~75 cm (mean: 55.7) Elevation: 2700~4300 m MAAT: -0.4~8.6˚C (mean: 3.8) AP: 270~900 mm (mean: 540) MAWAT:-7.2~4 ˚C (mean: -1.9) SFG: 8~130 cm (mean: 64.7) Elevation: 3900~4800 m MAAT: 0.3~-3˚C (mean: -1.2) AP: 430~550 mm (mean: 481) MAWAT:-6.2~-9.8 ˚C (mean: -8) SFG: 170~330 cm (mean: 232)
Changes of freezing beginning, ending dates and SFG duration
QUESTIONS? THANKS!