Ratios Analysis
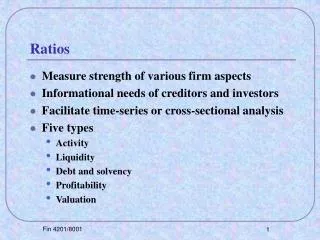
Ratios Analysis. Learning Outcome. State the functions of accounting ratios Calculate a range of ratios Draw logical conclusion from the ratios State the limitations associated with ratio analysis. Uses of accounting ratios. Enable comparison of the performance of the company


Ratios Analysis
E N D
Presentation Transcript
Learning Outcome • State the functions of accounting ratios • Calculate a range of ratios • Draw logical conclusion from the ratios • State the limitations associated with ratio analysis
Uses of accounting ratios • Enable comparison of the performance of the company • - in different years • - with its budgets and forecasts • - with other companies in similar trades
Uses of accounting ratios • Provide information of the company in respect of the liquidity, profitability, use of assets and capital structure • Eliminate the effects of the scale and size of different companies or different years of the same company so comparison can be provided. • Appraise the performance of the company, make predictions for future performance and assist in future planning
Accounting ratios and interpretation • Liquidity • - current ratio / working capital ratio • - acid test ratio / quick ratio / liquid ratio • - stock turnover rate • - stock turnover period • - debtors’ collection period • - creditors’ payment period
Liquidity • Liquidity is a measure of the amount of funds a company can quickly use to settle its debts.
Liquidity – current ratio • This ratio indicates the ability of a business to meet its short-term liabilities from its current assets. • The norm is 2:1. • If the ratio is too high, the company may be holding too many idle short-term assets. (They may be used in a more profitable way.) • If the ratio is too low, the company may not have sufficient funds to meet its short-term liabilities.
Liquidity – acid test ratio • This ratio indicates the ability of the business to meet its short-term liabilities from its quick assets. • The norm is 1:1. • If the ratio is too high, the company may be holding excessive liquid assets. • If the ratio is too low, the company may have a liquidity problem / cash flow problem.
Liquidity – stock turnover rate • It shows the number of times that a business can sell its average stock in a period. • A high ratio means high sales, fast stock turnover and a low stock level. • A low ratio means low sales, low stock turnover and a high stock level. (goods may become obsolete, high storage cost)
Liquidity – debtors collection period • This ratio measures the debt collection period of a business. • A low ratio means debtors pay back their debts in a short period of time. The company may have sufficient liquid fund. • A high ratio indicates a poor credit control and a high risk of bad debts.
Liquidity – creditors payment period • This shows the length of time taken to pay the creditors. • A long payment period may indicate that the company has a liquidity problem. The relationship between the company and the suppliers may be affected.
Accounting ratio and interpretation • Profitability • - gross profit ratio / gross margin / profit to sales ratio • - net profit ratio / net profit margin • - return on capital employed • - assets turnover
Profitability – gross profit ratio • It shows the gross profit on sales. • A low ratio means the stock is being sold at lower prices. It may be a policy to stimulate sales. • A high ratio may not result in high gross profit figure unless a large volume of sales is achieved.
Profitability – net profit ratio • It shows the net profit as a percentage of sales. • It gives some ideas of the company’s pricing policy and cost control. • A low ratio may be the result of lower selling prices or higher operating costs.
Profitability – return on capital employed • This ratio shows the profitability of a business and the management effectiveness in terms of the use of capital. • A higher ratio means a higher profitability and a better management efficiency.
Capital employed (Sole trader) • Closing capital • Average capital • Capital balance + long term loans
Capital employed (Partnership) • Closing balance on fluctuating capital accounts • Average of opening and closing balances on the fluctuating capital accounts • Total of fixed capital accounts plus total of current accounts • Average of fixed capital accounts plus total of current accounts • Any of the above plus long term loans to the partnership
Capital employed (Limited company) • - total assets • - long term suppliers of capital (ordinary shares + preference shares + reserves + long-term loans) • - shareholders’ capital (ordinary shares + preference shares + reserves) • - shareholders’ equity (ordinary shares + reserves)
Return • Net profit after tax and preference share dividends (for ordinary shareholders) • Net profit after tax + any preference share dividends + debenture and long-term loan interest (for all long-term suppliers of capital)
Profitability – assets turnover • This indicates the efficiency of the business in using its assets to generate revenues. • A higher ratio means the company is more efficient to use its assets to generate revenues. This results in higher profitability.
Accounting ratios and interpretation • Management efficiency • - stock turnover rate • - debtors ratio • - creditors ratio • - assets turnover
Management efficiency • Stock turnover rate measures the efficiency of sales and stock levels of a company. • Debtors ratio indicates the credit control of the company. (lenient credit control?) • Creditors ratio indicates the ability of the company to obtain long-term financing. • Assets turnover shows the efficiency of the business in using its assets to generate revenues.
Accounting ratios and interpretation • Long-term solvency and stability • - debt ratio • - gearing ratio
Debt Ratio • Debt ratio • Total debts • = ---------------------- X 100% • Total assets
Long-term solvency – debt ratio • Debt ratio shows the total amount of liabilities to total assets. • If the debt ratio is too high (more than 50%), it is difficult to obtain further financing and it also has a heavy burden of interest expense.
Gearing ratio • Gearing ratio • Prior charge capital • = --------------------------------------- X 100% • Total capital • Prior charge capital = preference shares + long term loans • Total capital = ordinary share capital + reserves + preference shares + long term loans
Long-term solvency – gearing ratio • It is concerned with the company’s long-term capital structure. • A high gearing ratio indicates a high portion of funds is obtained from borrowings. It may lead to long-term insolvency. It is difficult to obtain further financing and has to bear a high interest burden. • Ordinary shareholders may not get any dividends in bad times as very little profit is left over for them
High geared company Investment is more risky Larger dividends will be available in good times Low geared company The risk of investment is relatively lower It is more certain to have dividends. Gearing ratio (P.648 – P. 649)
To reduce gearing By issuing new ordinary shares By redeeming debentures By retaining profits To increase gearing By issuing debentures By buying back ordinary shares in issue By issuing new preference shares Changing the gearing
Accounting ratio and interpretation • Investment appraisal • - earnings per share • - price earning ratio • - dividend cover • - dividend yield
Earnings per share • Earnings per share (EPS) • Net profit after tax and preference dividends • = ------------------------------------------------------ • No. of ordinary shares issued • (ranked for dividends)
Investment appraisal – earning per share • It shows the profit in dollars associated with each ordinary share. • A higher earnings per share indicates the investors may have higher confidence in the company. It is more profitable to invest in the shares.
Price / earning ratio • Price / earning ratio • Market price per share • = ----------------------------------------- • Earnings per share
Investment appraisal – price earning ratio • This ratio indicates the number of years required to earn the amount invested in the shares. • A high ratio indicates investors have strong confidence in the company. • An unreasonably high ratio may be the result of speculation in the stock market.
Dividend cover • Dividend cover • Net profit after tax and preference dividends • = ------------------------------------------------------- • Ordinary dividends paid and proposed
Investment appraisal – dividend cover • It shows the amount of profit that has been distributed as dividends. • A low ratio means a large amount of profits has been retained as reserves which can help to finance the operations of the company. • A high ratio means a large amount of profits has been distributed as dividends. The dividend payment is vulnerable unless the company becomes more profitable.
Dividend yield • Dividend yield • Dividend per share for the year • = -------------------------------------------- X 100% • Current market price of the share
Investment appraisal – dividend yield • This ratio measures the rate of return obtained from dividends on an investment in shares. • A high dividend yield may imply the company is more successful and efficient. It is more profitable to invest in these shares.
Other ratios (P. 649) • The company will be able to pay interest on the loan when it falls due. (short-term liquidity) • - current ratio and acid test ratio • It will be able to repay the loan on maturity. (long-term solvency) • - operating profit / loan interest • - total external liabilities • - shareholders’ fund / total assets
Examples of interested group (P.641) • Profitability • - shareholders • - management • - employees • - creditors • - competitors • - potential investors
Examples of interested group • Liquidity • - shareholders • - suppliers • - creditors • - competitors
Examples of interested group • Management efficiency • - shareholders • - potential purchasers • - competitors
Examples of interested group • Investment appraisal • - shareholders • - potential investors
Examples of interested group • Capital structure • - shareholders • - lenders • - creditors • - potential investors
Limitations of ratio analysis • Different definitions of capital employed may cause confusion. • Changes in price level will affect the comparability of the ratios between two financial periods. • Changes in external environment will affect the comparison.
Limitations of ratio analysis • Differences in management and background of various businesses may affect the comparison. • Different accounting definitions, methods, techniques and policies used by various businesses may affect the comparability. • It is difficult to set up a proper standard for good performance. • Short term fluctuations may not be reflected.