Download
1 / 12
120 likes | 241 Vues
This study examines observational constraints on aerosol deposition and optical depth, utilizing new ice core measurements to analyze sulfur and black carbon (BC) deposition in Greenland from 1790-2000. By comparing historical reconstructions of aerosol emissions with transient climate simulations, the research aims to improve understanding of aerosol transport processes and refine AeroCom data. Results suggest discrepancies between model predictions and observations, highlighting areas for further investigation. The study also evaluates Amazon aerosol optical depth during biomass burning seasons, exploring ways to enhance modeling accuracy through sensitivity experiments and parameter adjustments. Overall, the research provides valuable insights into historical trends, climate impacts, and potential biases in aerosol modeling.

E N D
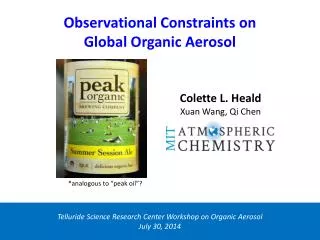
Mark Flanner1 Phil Rasch1 Jim Randerson2 Joe McConnell3 Tami Bond4 1 NCAR 2 University of California at Irvine 3 Desert Research Institute, Reno NV 4 University of Illinois Observational Constraints on Aerosol Deposition and Optical Depth
New possibilities • New ice core measurements yield monthly resolution of Sulfur, BC deposition at D4, Greenland from 1790-2000. • Historical reconstructions of aerosol emissions (e.g., Bond et. al., 2007) • Comparisons with transient climate simulations could help constrain AeroCom data and transport processes McConnell et al., (2007) 20th Century Black Carbon Emissions Altered Arctic Climate Forcing, Science.
CAM and observed Sulfur deposition • Reasonable 1870-1920 agreement • Observations show smaller rise in 1900s than model predicts • Diminishing S deposition in late 1970s seen in both model and obs. • Model deposition is higher than obs. by a factor of ~3. 1870-2000 CAM transient simulation using historical SO2 emissions from Smith et al., (2004)
CAM and observed BC deposition • Good “shape” agreement during both pre-industrial and present • Early 1900s maxima in both model and observation; likely reflect technology changes in North America – less bunker oil consumption • Consistent model high-bias of a factor of 2-3 • Inconsistent with other Arctic obs? 1870-2000 CAM transient simulation using historical BC emissions from Bond et. al., (2007).
Possible sources of high model deposition • Excessive emissions • Less likely for SO2 precursor • Excessive model precipitation (and hence wet deposition) over ice core site • (next slide) • Excessive tracer transport into Arctic • Will test transport sensitivity with 1970-2000 offline CAM, prognostic aerosol simulation • (GHGs were held constant in this transient run) • Hydrophilic transformation time (BC) or solubility (BC or S) • MOZART vs. “MODAL” (Liu) showed higher SO4 over Greenland • Measurement errors or inconsistent definition of (e.g., ) “black carbon” • McConnell: Measurement uncertainty range: ~10% • Oxidation rate (sulfate only) • IPCC shows minimal change in oxidative capacity
Excessive precipitation?... no • Mean annual: • Observed accumulation: 415 kg m-2 yr-1 • Modeled accumulation: 387 kg m-2 yr-1 • (Sublimation was assumed from an earlier run, and is ~10% of annual snowfall. No runoff) • Excessive washout at ice core site is not cause of discrepancy • But, too little washout between source and Greenland could contribute
Part II. Modeled and observed Amazon AOD • Amazon experiences regular, annual biomass burning during dry season • Test modeled AOD during burning season using GFEDv2 emissions (van der Werf, Randerson) • Observational data: • MODIS: excellent spatial coverage • MISR: superior data quality, but poor spatial and temporal coverage compared with MODIS • AERONET: “truth”, but only at points • (Application: Use CAM as a tool for quantifying diffuse radiation enhancement of NPP)
Motivation for improvement • Offline CAM experiments prescribing GFED aerosol emissions underpredict the observed annual AOD cycle associated with South American biomass burning
Sensitivity experiments to improve AOD • 1) Prescribe total particulate matter (TPM) emissions, instead of BC and OC (TPM≈2*[BC+OC]) • Assign new AERONET-derived “smoke” optical properties (Reid et al., 2003) to these biome-specific “fire” aerosols. • 2) Decrease the hydrophobic-hydrophilic e-folding transformation time to 0.6 days • Hydrophilic aerosol mass extinction depends sensitively on relative humidity. Thus, a higher fraction of hydrophilic aerosol could produce greater optical depth (especially in humid environment like Amazon) • 3) Inject all aerosol at 2000m instead of at surface • Bound the plausible range of effect that a more realistic emission height algorithm could have on AOD
Conclusions • Both S and BC appear to be over-deposited at D4 • “Simple” experiments to reduce biomass burning biases resulted in marginal improvements relative to AERONET • Biomass burning seasonal AOD spikes are significantly under-predicted with CAM, GFED emissions • Possible sources of bias • No SOx, NOx emissions • No secondary organic aerosol • No primary biogenic particle emissions (N. Mahowald) • Removal processes, solubility • Coarse mode, potentially important for local sources • Biased emission factors? • GFED CO inversion (cannot recover whole bias) • MISR agrees better with AERONET than MODIS, but shows occasional unrealistic spikes