Slope in Mathematics - Lesson Recap and Practical Examples
Learn about slope in mathematics, its relevance in graphs, and how to calculate it using tables. Discover positive, negative, zero, and undefined slopes with practical examples. Master the slope formula and how to interpret different slope values. Enhance your knowledge and skills with clear explanations and hands-on exercises.


Slope in Mathematics - Lesson Recap and Practical Examples
E N D
Presentation Transcript
Slope Lesson Three Slope from Tables
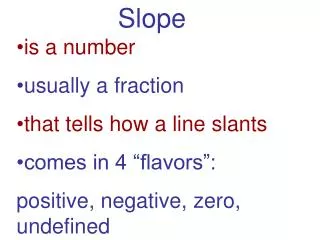
RECAP What is Slope? Slope is the rate of change of a line (change in y) (change in x)
What does the line look like when… • You have positive slope? • You have negative slope? • You have zero slope? • You have NO slope?
Positive slope, + work Negative slope, - work Zero slope is zero fun! NO slope. Oh No!!!! Slope Mountain Ski Resort https://www.youtube.com/watch?v=avS6C6_kvXM
What Type of Slope is Shown? Positive Slope Negative Slope Zero Slope No Slope/Undefined
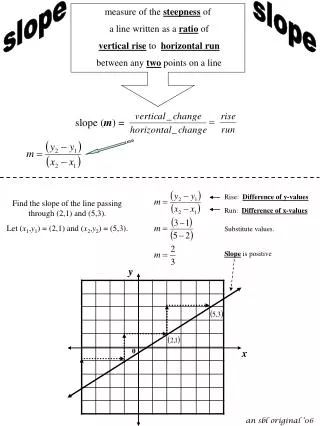
Slope of a Graph • When slope is positive or negative we need to find the actual value of the slope or rate of change. • On a graph we find slope using the formula. How far up or down it changes How far left or right it changes
Slope of a Graph • First pick two points on the line • The points need to be where the lines cross so they are integers • 2. Then find the rise and run • 3. Determine if the slope of the line is positive or negative Rise = 2 Run = 3
Slope of a Graph • First pick two points on the line • The points need to be where the lines cross so they are integers • 2. Then find the rise and run • 3. Determine if the slope of the line is positive or negative Rise = 10 Run = 2
Slope from a Table 8 6 4 2 y 3 3 3 2 2 2 2 units 3units x 3 units 2 units 0 2 4 6 8 2 3 The slope is . You can find the slope of a line if the points from the line are put into a table. We use a special formula. Graph Table x y 0 1 3 3 6 5 9 7
Slope Formula y2–y1 x2–x1 We can use the slope formula to find the slope from a table. Here it is. Copy it into your notes. You will need to learn this formula as you will be using it often. slope =
Slope from a Table • In a table we can find the rate of change by finding the change in y and the change in x. • We can use any two points from the table that show some form of pattern. Pick any two rows. If it is linear it will be the same no matter which two rows you pick y1 x1 x2 y2
Examples • Find the slope for each table below
Conclusion the rate of change of a line • Slope is: • Describe the slope of each of the following Zero/0 slope Undefined/ No slope Positive slope Negative slope