Download
1 / 8
80 likes | 99 Vues
Learn how to install and start using CRYSTALS software for crystal structure analysis. Customize settings and solve a routine crystal structure example step-by-step. Follow the detailed guide for importing data, refining, and assessing crystal structures.

E N D
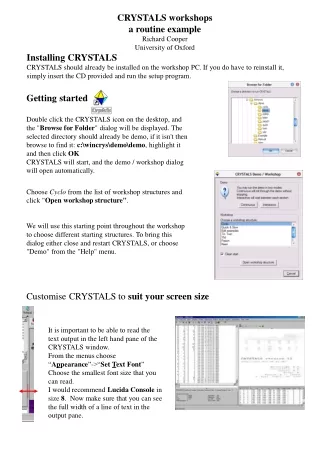
CRYSTALS workshops a routine example Richard Cooper University of Oxford Installing CRYSTALS CRYSTALS should already be installed on the workshop PC. If you do have to reinstall it, simply insert the CD provided and run the setup program. Getting started Double click the CRYSTALS icon on the desktop, and the "Browse for Folder" dialog will be displayed. The selected directory should already be demo, if it isn't then browse to find it: c:\wincrys\demo\demo, highlight it and then click OK CRYSTALS will start, and the demo / workshop dialog will open automatically. Choose Cyclo from the list of workshop structures and click "Open workshop structure". We will use this starting point throughout the workshop to choose different starting structures. To bring this dialog either close and restart CRYSTALS, or choose "Demo" from the "Help" menu. Customise CRYSTALS to suit your screen size It is important to be able to read the text output in the left hand pane of the CRYSTALS window. From the menus choose “Appearance”->“Set Text Font” Choose the smallest font size that you can read. I would recommend Lucida Console in size 8. Now make sure that you can see the full width of a line of text in the output pane.
You can drag the bar situated between the text area on the left and the CRYSTALS logo screen on the right, to adjust the relative sizes of these two areas. The area on the right will eventually display a representation of the atomic co-ordinates, so leave it at least a little bit of space. Solving and refining a routine structure in CRYSTALS Some information about the structure you are about to solve and refine This natty material was supplied as very poor colourless crystals found congealed in the bottom of a half-abandoned flask. A fragment of crystal (0.3 x 0.4 x 0.4 mm) was mounted in oil on a KCCD diffractometer at 190K and a data set collected in two hours. The space group is P 21 21 21 The Guide: The guide will lead you through a routine example. If it is not visible, it can be started by clicking on the icon on the toolbar. It can be automatically started via the Help menu. The GUIDE provides a list of options. To carry out the current recommended action you would just click OK. You can change the action by clicking the little arrow to the right of recommended action, and choosing a new action from the list. Ensure that the action selected in the GUIDE is "Import data". Click the OK button on the GUIDE. Choose the cyclo.ins file, then click Open. You will be invited to refine with F or F2. Choose F-squared for compatibility with the rest of this demo.
Enter the space group symbol. CRYSTALS will automatically find it if it is on the TITL card of a Bruker format .ins file. Otherwise, type it or select it from the menu. Now we need to import reflection data. The reflection file name ‘cyclo.hkl’ should already be filled in by default, otherwise click "Browse", choose the cyclo.hkl file, then click OK. The next dialog advises you about merging and treatment of Friedel opposites. Read, and then click OK. Finally, the filter reflection dialog appears. This lets you omit reflections based on various thresholds. A (sin theta/lambda)2 cutoff of 0.01 removes occluded low angle reflections. For F refinement, set an I/σ(I) cutoff of +3.0, for F2 set -3.0 Click OK Step three: Initial assessment of the data It is useful to get an idea of the quality of your data set before proceeding. The guide has moved onto the "Solve" stage, but is recommending "Initial analyses" so that you can check the data set. Click OK. The initial analyses window appears. Click on each tab, and convince yourself that the data set looks reasonable. Some of the graphs allow you to choose cut-off limits for the data set (based on I/sigma(I) or (sin /)2) if you click with the right mouse button. However, don't do this for now.
To rotate the structure: Point into some empty space, hold down the left-mouse button and drag the mouse around. To change an element: Choose the new element type in the pull-down listbox. Click the atom that you want to change. The last tab is particularly useful as it checks that the cell contents are reasonable given the cell volume, and that the number of observations is reasonable given the expected number of final parameters. Scroll up the text window and note the mean I/Sigma(I) for the systematic absences, and the percentage of data over 3 sigma. Step four: Structure solution The guide should now be recommending Run Sir92. Click OK SIR 92 should solve the structure in under a minute, depending on the processor speed of your machine. Click the “Quit” button (top left) twice to close down SIR. Click Yes to import SIR’s solution back into CRYSTALS. Step five: Check that the structure is correct Change the types of the two incorrect atoms so that the model matches the expected chemical diagram (see page 1 of this handout). Once the structure is correct, click “Done”. You will then be asked if you want to renumber the structure. Make up your own mind about renumbering the atoms or simply click “Automatic”.
Step six: Commence refinement... CRYSTALS will change the model style from Ball to Ellipse so that you can see how the anisotropic temperature factors are behaving as the structure refines. You can change this by clicking the Ellipse button on the toolbar above the model. The guide recommends “Refine posn and aniso. Click OK The Least Squares Directives panel opens with Scale, positions, Uijs selected. Click OK. Refinement should converge at 7-8% - see info tab. Step seven: Adding Hydrogen Atoms The GUIDE has decided that it is time to add hydrogen atoms. Click OK to do this. • Difference Fourier map peaks are shown in PINK (labelled QH). • Theoretical H positions are shown in WHITE (labelled H). • There are two reasons for this step: • Test the quality of the Fourier map – if the H and QH coincide then the map quality is good. • Find H that cannot be placed theoretically. Note that CRYSTALS has not tried to predict the H on nitrogen. If you can see the H from the difference map (pink) change it fro QH to H. Ensure Create systematic numbers and Regularize the H using restraints are ticked. Click All atoms found if they have been. Click Done and watch the methyl groups refine to optimal positions.
Step eight: More refinement & Extinction The Guide suggests more refinement. Note that Ride H atoms is selected. After some refinement, the Guide recommends checking for extinction. Click OK. The extinction check graph is displayed. It plots Fo against Fc. If extinction is a problem for the crystal, the graph will flatten out (drop under the blue Fo-Fc line) at high values of Fc. Extinction isn't a problem here. This graph can also reveal outliers - points a long way from the line. If you can rationalise the problem, these points can be omitted from calculations. Remove the outliers by right-clicking on the offending points and choosing "Omit". A common problem is partial occlusion behind the beam trap, giving Fo << Fc. (as illustrated) Click the "Do not" button to close the window and continue without an extinction correction. Step nine: Choose a nice weighting scheme The Guide recommends choosing a weighting scheme. Click OK. The drop-down menu has several options. For F2 refinement, CRYSTALS proposes Auto Statistical (similar to SHELXL) weights. Click OK. In the plots, the red bars are the unweighted residuals, the green with weights applied. Note that except for bins with only a few reflections in them (blue curve) the green weighted residuals are close to unity. This is good. Note the GOF on the refinement tab – about 0.6 After the weights have been computed, CRYSTALS does more refinement. Note that the GOF becomes close to 1.0.
Step ten: Validation and CIF archival. Click OK on the GUIDE to carry out a few last cycles of refinement. The GUIDE now recommends "Validate" (this means that it's happy that the structure is complete). Click OK to validate the structure. A list of tests and any failures will appear in the text window on the left. If the shift/esd is causing a warning then: Change the GUIDE default option to Refine posn and aniso and click OK. Then carry out the validation again. This time, there should be no problems with the structure. If all checks passed, the GUIDE will recommend Publish. In any case, ensure that Publish is the selected option in the GUIDE and click OK. A variety of data formats are available for publication/archiving. Choose CIF, which contains just about everything that you need. Click OK to write a CIF. Open the CIF for editing if you want to. Close the Publish dialog. If you have a web connection you could choose “Results”->”Checkcif on the web” from the menus for further checks. Browse you way to the current directory. All kinds of alerts will be generated. This is because the .ins file did not contain information about crystal size, colour etc etc. On the Results menu, choose Edit CIF goodies and fill in the missing items. If you have a web connection you could choose “Results”->”Printcif on the web”. This will create a pre-print of a crystallographic publication.
Other tools. CAMERON Cameron is a software program (built into CRYSTALS) for producing publication quality packing diagrams and thermal ellipsoid plots. (Note that the 3D viewer in CRYSTALS does not produce printable output, nor does it show the packed structure). The on-screen menu contains some common operations. Much more can be done from the command line. See the manual. Click the Cameron button on the CRYSTALS toolbar. Resize the window and panes of the window so that the diagram is nice and big. e.g. Investigate the hydrogen bonding network of the cyclo structure as follows: To pack the structure, open the drop-down menu in the right panel, which currently says “Unpack”. Change the option to “Complete” To see the H-bonds, type “CONN HBOND o n 0.0 2.2 VIEW” (NB. That’s “o” for oxygen, “n” for nitrogen, then the numbers 0.0 and 2.2) Click the buttons “Axis a”, “Axis b” and “Axis c” to look at the structure along the different crystallographic axes. Bear in mind that the space group is P 21 21 21 : there are two fold screw axes in each unit cell direction. You should be able to see these as you view along the axes. Changing the pull down which says “Spheres” to “Ellipses” allows you to see the thermal ellipsoid plots for the atoms. When you have a picture you like, you can save it to a postscript file. You can also archive the view in a form that can be opened and modified later. Electron Density Viewer (Rohlicek & Husak) Click on three or more atoms in the structure. As you click the atoms, their appearance changes – they are now selected atoms. Point at one of the selected atoms with the mouse and press the right mouse button. A popup-menu will appear. From the popup-menu, choose “Slant Fourier map” There are two common types of Fourier map – an /Fo/ map will attempt to map all of the electron density in the structure, and an /Fo/-/Fc/ (difference) map which effectively shows you any electron density that is missing from your model. Click OK to calculate the map and start the MCE Fourier viewer. The 3D view of the map can be rotated around by dragging with the mouse. Three 3-D contour layers are displayed, the contour height of each can be changed using the MCE controls, and each layer can be turned on or off independently.