Understanding Uncertainty: Visualizing Probabilities and Real-World Applications
This presentation by David Spiegelhalter from MRC Biostatistics explores the visualization of probabilities and uncertainty in various contexts, including a Met Office experiment and the "Cone of Uncertainty" for hurricane forecasting. Engaging quizzes challenge participants to evaluate their confidence in answers while promoting discussions about how we assess uncertainty in everyday situations. Dive into the scoring rules and learn to quantify ignorance, enhancing your appreciation for uncertainty in decision-making.

Understanding Uncertainty: Visualizing Probabilities and Real-World Applications
E N D
Presentation Transcript
Communicating and evaluating probabilities David Spiegelhalter MRC Biostatistics and Statslab CSI day: September 2011 With thanks to Mike Pearson and Ian Short
Summary • Visualisations • Met Office experiment • Scoring rules for a quiz Spiegelhalter DJ, Short I and Pearson MP (2011) Visualisation of uncertainty about the future. Science333, 1393-1400
2011: NBC News for Hurricane Katia ‘Possible futures’ metaphor
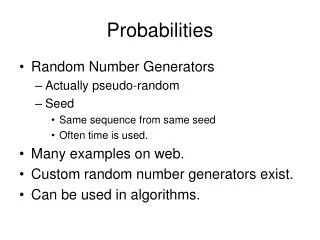
Quantifying your ignorance • Think whether you prefer (A) or (B) for each question • Then think of how confident you are with your answer • Give your confidence a number 5 to 10 • Score yourself when you hear the correct answer
A short quiz 1. Which is higher, A) the Eiffel tower, B) Canary Wharf? A (324m vs 235m) 2. Who is older, A) Prince William or B) Kate Middleton ? B (Born 21/6/82 vs 9/1/82) • In the IMDB rankings (20/05/2011), which film comes higher, A) Toy Story 3 or B) WALL.E? A (34th vs50th) 4. Which is larger, A) Belgium or B) Switzerland? B (30 vs 41 000 sq km) 5. Which is bigger, A) Venus B) Earth? B (6051 vs 6371 km radius) 6. Who died first, A) Beethoven or B) Mozart? B (1827 vs 1791)