November 2010
November 2010. April 2011. SATEC 25 years of Innovation in measurement & management of Energy and Power Quality. Universities. Gas. Pharmaceutical. Transportation. Transmission. Data Centers. Supermarkets /Wholesale. Banks. Process Industry. Generation. OEM. COMMERCIAL.

November 2010
E N D
Presentation Transcript
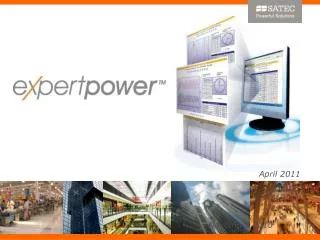
November 2010 April 2011
SATEC25 years of Innovation in measurement & management of Energy and Power Quality
Universities Gas Pharmaceutical Transportation Transmission Data Centers Supermarkets /Wholesale Banks Process Industry Generation OEM COMMERCIAL INDUSTRIAL UTILITIES Mining Telecom Hi-Tech Automotive Distribution Sports Semiconductors Residential
The Full Range of Electricity Management Solutions for Every Application PAS eXpertpower™ Server (SaaS) eXpertpower™ Server (Pro Edition) Internet eXpertpower™ LAN ETC2002 RS232/422/485, Profibus, TCP/IP, Dialup modem, GPRS, RF Modbus RTU, ASCII, DNP3.0, Modbus/TCP, DNP3/TCP, IEC 61850 PM130 PLUS BFM136 C192PF PM172 PM296 PM174/5 EM720 EM920 ezPAC Substation Automation Asset Management Power Measurement Fault Recording Energy Efficiency & Cost Allocation Revenue Metering Energy Management & Billing Smart Grid & Demand Response Power Quality Analysis Multi-Tenant Submetering UTILITIES & RENEWABLE COMMERCIAL & INDUSTRIAL ALL
Present Information, Control operations and Makes strategic decisions eXpertpower™ • Data are highly accessible and presented to facilitate decisions Web-based - Energy Management System
eXpertpower™ • Collects data from meters • Analyzes the data • Presents the information using: • Dashboards • Standard Data Displays • Graphical Presentations • Interactive Graphs • Export Tools • Reacts!
Analysis Multi-Dimension Comparisons History Archiving and Display Navigation AMR Data Collection & Presentation Data Collection and Presentation Reports & Graphs Events & Alarms Power Quality Sub- Metering Energy Efficiency Demand Response Apps
Data Collection: Presentation No more running to the display panel - The data comes to you Different Measurement pages represent the various device types
Data Collection: Navigation Unique pages represent the full range of network view: from high-level overview to a specific device Graphic pages tailored to allow for easy navigation even in complex systems
Analysis Multi-Dimension Comparisons History Archiving and Display Navigation AMR Data Collection & Presentation Data Collection and Presentation Reports & Graphs Events & Alarms Power Quality Sub- Metering Energy Efficiency Demand Response Apps
History: Archiving and display Use Historic data to detect trends and anomalies
Analysis Multi-Dimension Comparisons History Archiving and Display Navigation AMR Data Collection & Presentation Data Collection and Presentation Reports & Graphs Events & Alarms Power Quality Sub- Metering Energy Efficiency Demand Response Apps
Power Quality View and analyze Power Quality events
Power Quality Compare to EN50160 Standard
Sub-metering • Calculate costs of any monitored point: • Charge External Users • Monitor Costs
Energy Efficiency Monitor Consumption Detect Energy Loss
Demand Response Make the most of utility incentives
Analysis Multi-Dimension Comparisons History Archiving and Display Navigation AMR Data Collection & Presentation Data Collection and Presentation Reports & Graphs Events & Alarms Power Quality Sub- Metering Energy Efficiency Demand Response Apps
Analysis: Compare on time line • Wide range of Analytical tools to compare: • Time Line • Locations • Utility Measurements
What’s New in Ver. 2011 • User Interface: • Updated UI: graphics, navigation, controls, search • Customized dashboard • Support for multiple browsers: IE, Firefox, Safari • AMR: • Multithreaded single process • Enhanced connection monitoring • Security standards: • Authentication • API • Stand alone mode • System API for 3rd party integration • Web services • Supports OEM branding • Knowledge base web site • Internal logic optimization
Display Screens - User • Dashboard • Readings: • Last Readings • History • Max Demands • Data logs • Energy: • Total • Import • Export • Events View • Report Wizard • Data Entry: • Import • Energy Diary
Display Screens - Admin • Maintenance: • Customers • Sites • ETCs • Devices • Permissions: • Roles • Users • Events Definition • License Management • System Settings
SATECEmpowering the Smart Grid November 2010