Download

1 / 27
290 likes | 604 Vues
Measures of Position. Where does a certain data value fit in relative to the other data values?. N th Place. The highest and the lowest 2 nd highest, 3 rd highest, etc. “If I made $60,000, I would be 6 th richest.”. Another view: “How does my compare to the mean?”.

E N D
Measures of Position Where does a certain data value fit in relative to the other data values?
Nth Place • The highest and the lowest • 2nd highest, 3rd highest, etc. • “If I made $60,000, I would be 6th richest.”
Another view: “How does my compare to the mean?” • “Am I in the middle of the pack?” • “Am I above or below the middle?” • “Am I extremely high or extremely low?” • Score is the measuring stick
Score: is how many standard deviations away from the mean? If you know the x value To work backward from z to x Population Sample • Population: • Sample
score is also called “Standard Score” • No matter what is measured in or how large or small the values are…. • The score of the mean will be 0 • Because numerator turns out to be 0. • If is above the mean, its is positive. • Because numerator turns out to be positive • If is below the mean, its is negative. • Because numerator turns out to be negative
score basics, continued • Typically round to two decimal places. • Don’t say “0.2589”, say “0.26” • If not two decimal places, pad • Don’t say “2”, say “2.00” • Don’t say “-1.1”, say “-1.10” • scores are almost always in the interval . Be very suspicious if you calculate a score that’s not a small number.
Practice computing z scores • What are the scores for the salary values ? • What are the salaries corresponding to the scores ? • Helpful necessary information:
scores can compare unlike values • Textbook’s example on next slide – they compare test scores on two different tests to ascertain “Which score was the more outstanding of the two?” • Be careful if the scores turn out to be negative. Which is the better performance? or ?
Example 3-29: Test Scores A student scored 65 on a calculus test that had a mean of 50 and a standard deviation of 10; she scored 30 on a history test with a mean of 25 and a standard deviation of 5. Compare her relative positions on the two tests. She has a higher relative position in the Calculus class. Bluman, Chapter 3
Percentiles • “What percent of the values are lower than my value?” • 90th percentile is pretty high • 50th percentile is right in the middle • 10th percentile is pretty low • If you scored in the 99th percentile on your SAT, I hope you got a scholarship.
Given value , what’s its percentile? • With these salary values again • What’s thepercentile for a salary of $59,000 ? • You can see it’s going to be higher than 50th.
Example: Finding the percentile • Count = how many values below $59,000 • Formula for percentile • 78th percentile
Excel will find the percentile • Excel will compute it but slightly differently. • PERCENTRANK.EXC(cells, value) • For $59,000Excel gives 0.74 • It does some fancy“interpolation”to come up withits results
Given Percentile, what’s value? • Formula: position from bottom • Again, how many data values in the set • and the percentile rank that’s given. • If there’s a decimal remainder, drop it. • If it’s integer, take average of th and th. • 33rd percentile: • So we look 6 positions from the bottom
Given percentile, find (continued) • 33rd percentile: • So we look 6 positions from the bottom • $43,546 • Excel: =PERCENTILE.EXC(cells,0.33)=$44,411
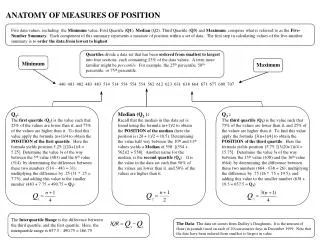
Quartiles Q1, Q2, Q3 • Data values are arranged from low to high. • The Quartiles divide the data into four groups. • Q2 is just another name for the Median. • Q1 = Find the Median of Lowest to Q2 values • Q3 = Find the Median of Q2 to Highest values • It gets tricky, depending on how many values.
Quartiles example • 0, 10, 20, 30, 40, 50, 60, 70, 80, 90, 100 • Q2 = median = 50 in the middle. • Remove it and split into subsets left and right. • Q1 = median(0, 10, 20, 30, 40) = 20 • Q3 = median(60, 70, 80, 90, 100) = 80
Quartiles example • 10, 20, 30, 40, 50, 60, 70, 80, 90, 100 • Q2 = median =. (two middle #s) • 55 isn’t really there so you can’t remove it! • Leave the 50 and 60 in place • Q1 = median(10, 20, 30, 40, 50) = 30 • Q3 = median(60, 70, 80, 90, 100) = 80
Quartiles example • 0, 10, 20,30, 40, 50, 60, 70, 80, 90, 100, 110 • Q2 = median = (two middle #s). • 55 isn’t really there so you can’t remove it! • Leave the 50 and 60 in place • Q1 = median(0, 10, 20, 30, 40, 50) = 25 • Q3 = median(60, 70, 80, 90, 100, 110) = 85 • Two middle numbers happened again!
Quartiles with TI-84 • 0, 10, 20,30, 40, 50, 60, 70, 80, 90, 100, 110 • Put values into a TI-84 List • Use STAT, CALC, 1-Var Stats
Quartiles in Excel • =QUARTILE.INC(cells, 1 or 2 or 3) seems to give the same results as the old QUARTILE function • There’s new =QUARTILE.EXC(cells, 1 or 2 or 3) • Excel does fancy interpolation stuff and may give different Q1 and Q3 answers compared to the TI-84 and our by-hand methods.
Quintiles and Deciles • You might also encounter • Quintiles, dividing data set into 5 groups. • Deciles, dividing data set into 10 groups. • Reconcile everything back with percentiles: • Quartiles correspond to percentiles 25, 50, 75 • Deciles correspond to percentiles 10, 20, …, 90 • Quintiles correspond to percentiles 20, 40, 60, 80
Interquartile Range and Outliers • Concept: An OUTLIER is a wacky far-out abnormally small or large data value compared to the rest of the data set. • We’d like something more precise. • Define: IQR = Interquartile Range = Q3 – Q1. • Define: If , is an Outlier. • Define: If , is an Outlier. • (Other books might make different definitions)
Outliers Example • Here’s an quick elementary example: • Data values 1, 2, 3, 4, 5, 6, 7, 8, 9, 10, 20 • Mean and • Anything more than 9 units away from is abnormal. Outlier, Outlier, Pants on Fire. • The 20 is an outlier.
No-Outliers Example • Data values 1, 2, 3, 4, 5, 6, 7, 8, 9, 10, 10 • Mean and (coincidence that , insignificant) • Anything more than 9 units away from is abnormal. • This data set has No Outliers.
Outliers: Good or Bad? • “I have an outlier in my data set. Should I be concerned?” • Could be bad data. A bad measurement. Somebody not being honest with the pollster. • Could be legitimately remarkable data, genuine true data that’s extraordinarily high or low. • “What should I do about it?” • The presence of an outlier is shouting for attention. Evaluate it and make an executive decision.