Download
1 / 23
230 likes | 337 Vues
This project focuses on the integration of aboveground net primary productivity (ANPP) data from various grassland ecosystems within the Long-Term Ecological Research (LTER) sites: Sevilleta (SEV), Jornada (JRN), and SGS. We assess data collection methodologies, issues encountered during integration, and provide a feedback loop from the ASM workshop. The goals include establishing common data schemas, enhancing visualization tools, and identifying transferable concepts. We aim to deliver a comprehensive database that supports ecological research and cross-site comparisons of productivity and species richness.

E N D
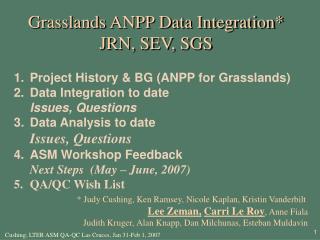
Grasslands ANPP Data Integration*JRN, SEV, SGS • Project History & BG (ANPP for Grasslands) • Data Integration to date • Issues, Questions • Data Analysis to date • Issues, Questions • ASM Workshop Feedback • Next Steps (May – June, 2007) • QA/QC Wish List * Judy Cushing, Ken Ramsey, Nicole Kaplan, Kristin Vanderbilt Lee Zeman,Carri Le Roy, Anne Fiala Judith Kruger,Alan Knapp, Dan Milchunas, Esteban Muldavin
Project History • Are DataBank concepts transferable beyond the canopy? • Can database components help the IMs? • Luquilla (Eda) – data visualization • Cross site analysis of NPP (JRN, SEV, SGS). • Compare production & species richness, using g/m2 per species per quadrat & number of species per quadrat. • Compare biomass over areas of ecological interest using measures of central tendency (mean, median, mode, and standard deviation) of g/m2 over biomes at each site. • OriginalGoals (Eco-informatics/CS) • Published ecology data integration case study • Proof of concept for DataBank integration • Use of CLIO for ecology data integration • Example of data integration and use of site databases at LTER • Sample ontology for data integration • Adjusted Goals (Ecology): to know we have done it ‘right’ • …something of value to the ecologists….
Grasslands Biomass Data Integration Schema unit LTER site m LTER subsite AANPP (weight) m species m veg zone m m m m m date 1 location season location Year? m 1 Site1LocationMap Site1LocationMap m Site1LocationMap TRT?
Scientific Background Modeling Annual Aboveground Productivity in Grasslands Soil & veg type Data Inputs Precipitation Wind Speed Radiation Soil Type Measurements of Biomass Satellite imagery Flux Tower array Plot level harvest Computational Model Parameter: Biome Type Productivity or Carbon Flow Productivity
Methods for Above Ground NPP (Collection of Productivity Data) Satellite Imagery Plot Level Harvest Flux Tower .25 m2 10 – 100 km 100 ha
Plot Level Harvest .25 m2 Collection Methods for Above Ground Net Primary Productivity at SGS Site: SGS Sampling Design: 6 Sub-Sites: esa, swale, mid-slope, ridge, section 25, and owl creek 3 plots: (called transects) at each sub-site 5 sub-plots: (called plots) at each plot Total of 90 ¼ m2 sub-plots harvested Harvest Methods: Clip at crown-level, except for shrubs. Plots are clipped by species. Drying oven at a temperature of 55 C and weighed in the lab
Aboveground net primary productivity, measured or calculated in autumn. Three LTERs: Sevilleta, Jornada, SGS NPP by species by plot Data from grasslands only: nothing from Sevilleta’s Pinon-Juniper woodland Contextual information on species and plots. Our Test-Case IntegrationWhat’s in the integrated database?
1093 species 44080 NPP measurements 1065 plots Covers 1989 - 2004 Size of the integrated database
Published LTER NPP data Published LTER site metadata (species list, study protocol) USDA PLANTS database Conversation with ecologists Conversation with IMs Database Creation
Integrating Dominant Vegetation Type The three LTERs have overlapping vegetation types Try: cross-site comparison of productivity by equivalent vegetation type.
Integrating growth forms A lowest-common-denominator classification for growth forms across 3 LTERs.
Integrating species very difficult 156 species found in > 1 LTER Species are constantly reclassified, so a timeline was constructed using author and reference. USDA Plants used to fill in missing species information. SEV: 660 JRN: 203 JRN + SEV: 126 JRN + SEV + SGS: 11 JRN + SGS: 5 SGS + SEV: 14 SGS: 41 Integrating species
Codes are site specific … ACNE Acacia Neovernicosa or Acalypha Neomexicana” • Over time, species differentiate : Bothriochloa saccaroidesBothriochloa laguroides, • LTER sites update at different times. • Some LTERs use subspecies & varieties; some do not distinguish below species level. • We integrated species across two dimensions. • updated older data with newer species codes using “authority” (author, publication). Jornada’s species database change log listed date of switch to a new “authority” – it was a BIG help! • The three separate updated species lists were merged with the official USDA species list. • For species diversity queries, we’re treating all subspecies as a single species. Issues 1: Species Codes
Issues (cont) • Form. Different LTERs use different categories as forms, e.g., all non-woody leafy herbs might be classed as forb, or separated into herbacious vine and herb…. • Timing. Biomass was measured at different times of year. We took only fall measurements, but…. • Plot Organization, Size. We did not combine hierarchies, but just used data at plot level. • Site types. Each research area is classified as a site type, but different terms are used, e.g., JRN Grassland = SEV black gramma
Analysis Questions Which analyses OK if missing data for one site for one year? Surprizing result: JRN ANPP is higher Not surprizing result: SEV has highest species diversity.
Analysis Summary JRN, SEV, SGS Plant Communities • Grassland LTER Synthesis 1999, Knapp&Smith 2001 • Average differences by LTER site and dominant vegetation type All photos shamelessly taken from various websites
Analysis • NPP – Total net primary productivity in a 1m2 plot • Species richness: Number of different species present in a 1m2 plot • Community analyses weighted by NPP or by species Presence/Absence • Indicator Species Analysis • Correlations with Environmental Variables – still organizing data
Grassland Community Analysis: Ordination Significant differences among LTER sites LTER Site Jornada SGS Sevilleta Based on Presence/ Absence A = 0.0945 P < 0.0001
Indicator Species Analysis 23 Indicator Species for Jornada LTER 29 Indicator Species for Shortgrass Steppe LTER 32 Indicator Species for Sevilleta LTER
ExtensionsMay and June Workshops • Add more years, look at trends through time • Add more sites: KNZ, two S. African sites, …. • Move to a “big-iron” database…. • Compute biomass by species (are these data available?) • Compute Presence/Absence by species (except SGS?) • Do cover-based ordinations (except SGS?) • Correlate ANPP with env. variables: precip, temp, soil texture, soil type, elevation, AET, soil moisture, PAR, soil temp Identify standard analyses (derived data), ala Trends? INVESTIGATE & DOCUMENT THE “CAN’T DOs”: • Relative frequency, diversity, species abundances, species richness (based on SGS methods)
Revisit Simplifying Assumptions Differences in data collection or methodologies …. Differences in ANPP calculation …. data result from regressions particular to each site. Differences in Plot Size ANPP probably scales up…. Species Richness (#species per plot) probably doesn’t…. Differences in plot designation ….
QA/QC* Wish List How do we automate integration and mark-up (even a little) ? • Our integration done by hand… not feasible…. • Tracking was ad hoc…. How do we track and distribute changes to data? • Species and species family changes (SEEK?) • Assignments to Form How do we document differences among data: • Methodology and plot differences, e.g., Sub-plot based analysis is below the scale of interest. Statistical n becomes 3 or 5, typical of ecological data, but ok once all years of data are analyzed How do we determine (and fix) critical ecology issues: • Under- or over-estimates, e.g., “SGS 14-17% under-estimate of cool seasons based on C14 data.” * Las Cruces, Jan 31-Feb 1, 2007.