Download
1 / 15
150 likes | 329 Vues
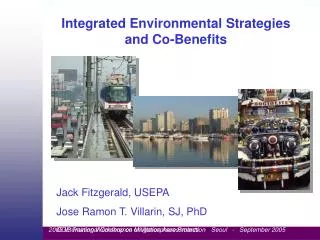
PRESENTATION ON INTEGRATED ENVIRONMENTAL STRATEGIES - INDIA PROJECT AIR QUALITY MODELING AS A VITAL COMPONENT IN IES-INDIA PROJECT. Dr. V. Srinivas EPTRI Hyderabad, India. OBJECTIVE&COMPONENTS. Analyzing and Identifying Strategies that Achieve

E N D
PRESENTATION ON INTEGRATED ENVIRONMENTAL STRATEGIES - INDIA PROJECT AIR QUALITY MODELING AS A VITAL COMPONENT IN IES-INDIA PROJECT Dr. V. Srinivas EPTRI Hyderabad, India
OBJECTIVE&COMPONENTS • Analyzing and Identifying Strategies that Achieve • Multiple Economic, Public Health and Environmental Benefits • While Improving Local Air Quality and Reducing GHG • Components • Emissions Inventory • Air Quality Modeling studies • Cost benefit Analysis • Transportation studies • Health Effects incl. Economic Valuation
Industrial Emissions Inventory • Data collected from regional APPCB offices over 550 industries. • Data collected for each industry includes type and quantity of fuel, stack details etc. • Base year for inventory is CY 2001. • Projections are made for CY 2011&2021
Emissions Estimation • Stack test data and emissions factors used to estimate PM 10 and GHG emissions from fuel usage. • GHG emission factors for India obtained from International Council of Local Environmental Initiatives (ICLEI). • PM 10 emission factors obtained from USEPA AP-42 document and World Bank Study
TOTAL ANNUAL GHG EMISSIONS FOR STUDY AREA (TONS eCO2): CO2 : 768, 816 N2O : 4, 085 CH4 : 26, 389 TOTAL ANNUAL PM10 EMISSIONS FOR STUDY AREA (TONS): PM1O : 1,187 Industrial Emissions Inventory (CY 2001) - For Baseline Scenario.
IES-INDIA ANALYSISAIR QUALITY MODELING STUDIES • The Air Quality Modeling (AQM) modeling study under the IES-India project was carried out for the Hyderabad Urban Development Area • The primary pollutant of concern PM10, was considered • The base year considered was CY 2001. • Projections were made for BAU-2011 and BAU-2021
Key features of Industrial Source Complex (ISC3) model: • The ISC3 model is a steady-state Gaussian plume model, which can be used to assess pollutant concentrations from a wide variety of sources associated with in the study area. • The important feature of the model includes handling multiple sources like point, volume, area, and open pit source types. • The inputs and options required/available for this model are: • Control options • Sources data • Meteorological data • Receptors information • After close observation of the study area and past experience in this area, EPTRI has chosen the ISC3 model in order to predict ambient air concentrations for the IES-India study.
AQM was carried out for the following Scenarios: 1)Baseline Scenario-2001 2) Business as usual(BAU)-2011 3)BAU-2011 with Effective Bus Transit System 4)BAU-2011 with Combined NG&BG fuel 5) BAU-2011 with Control 6) BAU-2011 with Fuel Additives 7) Business as usual(BAU)-2021 8)BAU-2021 with Effective Bus Transit System 9)BAU-2021 with Combined NG&BG fuel 10) BAU-2021 with Control 11) BAU-2021 with Fuel Additives
AQM Results – BAU 2011 (Mitigation Scenarios)
AQM Results – BAU 2021 (Mitigation Scenarios)
Conclusions Derived From AQ Modeling: • Comparingall the scenarios, the maximum concentrations are obtained in MCH area. • This may be due to movement of high vehicular population. • The projected avg. concentrations during BAU-2021 are very high. • it is observed that Effective Bus Transit mitigation scenario is the most effective scenario, in reducing the particulate and GHG emissions. • For BAU-2021, Patancheru and Rajendranagar would be the highly polluted areas (after MCH). • Industrial mitigation scenarios are not significant in MCH area. • But they are significant in reduction of GLCs in some the industrial areas, such as Rajendranagar, Gaddiannaram, Patancheru, Qutbullapur etc.
Limitations of AQ Modeling Study • For 2001, Emissions of 10 tpy or greater industries(23) were selected as point sources • And the remaining medium and small industries were considered as area sources. • There are no large power generation plants within the study area. • The domestic emissions are not significant when compared to the industrial or vehicular emissions. • Emissions from sources such as road dust, open burning and emissions from residential and commercial establishments have not been included.