150 Business Models
150 Business Models for powreful powerpoint presentations. Content overview: Break-even, Financing Life Cycle, Economies of Scale, Elasticity, Sales Cycles Market Potential, Portfolio Matrix, Product Model, Four P's, Push/Pull Strategy, Marketing Mix, PDCA Cycle, SWOT, Value Chain, Ansoff Matrix, BCG Matrix, 7-S Modell, Core Competencies, GE Business Screen, Nine Cell Industry Risk/Reward Diagram, Porter's Five Forces, Industry Competition, Generic Strategies, Geobusiness Modell, Porter's Diamond, Matrix Design, PIMS, Leavitt's Diamond, Belbin's Team Roles, Theory X/Y, Maslow's Hierarchy, Herberg's Theory, Cultural Web, Pareto Curve, CIM Concept, Value Drivers/nMore business diagrams to download on http://www.drawpack.com your visual business knowledge

150 Business Models
E N D
Presentation Transcript
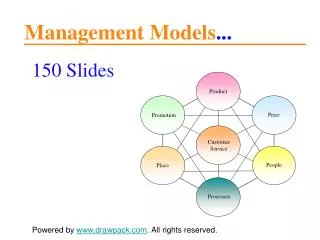
Product Price Promotion Customer Service Place People Processes Management Models... 150 Slides Powered by www.drawpack.com. All rights reserved.
Key Words... Break-even – Financing Life Cycle – Economies of Scale – Elasticity – Sales Cycles – Market Potential – Portfolio Matrix – Product Model – Four P’s – Push/Pull Strategy – Marketing Mix – PDCA Cycle – SWOT– Value Chain – Ansoff Matrix – BCG Matrix – 7-S Model – Core Competencies – GE Business Screen – Nine Cell Industry – Risk/Reward Diagram – Porter’s Five Forces – Industry Competition – Generic Strategies – Geobusiness Model – Porter’s Diamond – Matrix Design – PIMS – Leavitt’s Diamond – Belbin’s Team Roles – Theory X/Y – Maslow’s Hierarchy – Herzberg’s Theory – Cultural Web – Pareto Curve – CIM Concept – Value Drivers
Resources Money Resources Resource markets Money Taxes, goods Services, money Services, money Taxes Manufacturer markets Government markets Consumer markets Taxes, goods Services Services, money Taxes, goods Money Money Middlemen markets Goods and services Goods and services Markets and Structure of Flow
MACROENVIRONMENT IMMEDIATE INDUSTRY & COMPETITVE ENVIRONMENT Technology Legislation and regulations Suppliers Substitute COMPANY Rival Firms Buyers New Entrants Population demographics Social Values and Lifestyles The Economy at large A Company‘s Macroenvironment
Value $ Sales Profit Break-even Point Total costs Variable costs Fixed costs Current sales level 0 0 Units sold Break-even Point
Dollars (in thousands) Total revenue 1200 Target profit 1000 Total cost 800 600 Sales Volume in Units (in thousands) Fixed cost 400 200 0 10 20 30 40 50 Break-even Chart
Total Revenue 35 30 Total Costs 25 $ Millions 20 15 Fixed Expenses* 10 5 0 50 100 150 200 Break-even Volume (90,000) Units Sold (‘000) Profit Loss * Fixed Expenses = Marketing Expenses and Other Direct Expenses Break-even Volume
Break-even Regions Cash flow Returned capital break-even Cumulative revenue Cash flow breakeven $ EVA break-even Opportunity cost based on capital risk assumed P&L break-even
Financing Life Cycle Venture Capitalist Investment Banks & Banks FFF & Angels Early Growth Later Growth Seed Capital & Early Stage Enterprise Cash Flow Enterprise Financing Mezzanine Public Market 3rd 2nd Initial Public Offering 1st Time Valley of Death Break-even point Emerging Growth
S D F G E Price B A S D 0 Quantity Demand and Supply
Average cost LACs* Output *Long-run average costs (LACs) Increasing returns to scale, or economies of scale Economies of Scale
(total inelastic demand) e = 0 Price Price e = - 8 e < - 1 e = - 8 e = - 1 (total elastic demand) e > - 1 Quantity Quantity e = 0 P1 Price (-) P2 P1 (-) (+) Price P2 (+) 0 0 Quantity Quantity Demand is elastic and expenditure increases when price falls from P1 to P2 Demand is inelastic and expenditure increases when price falls from P1 to P2 Elasticity
P’2 P2 Price P’1 P1 Quantity Demanded per Period (a) Inelastic demand Quantity Demanded per Period (b) Elastic demand Q’1 Q’2 Q1 Q2 Inelastic and Elastic Demand
Sales Sales and Profits ($) Profit Introduction Growth Maturity Decline Time Sales and Profit Life Cycles
Volume or value Market potential Market volume Market share Time Market Potential, Market Volume, Market Share
Sales over profits Sales Profits Introduction Growth Maturiy Shake-out Decline Stages over Time The Product Life Cycle I
The Product Life Cycle II Introduction Growth Unit Sales Volume A B C Maturity Commodity or Decline Time Note: A = Moderate Growth, B = Commodity, C = Decline
THE BUSINESS UNIT‘S COMPETITIVE POSITION Strong Average Weak Development A C Growth B D Competitive shakeout THE INDUSTRY‘S STAGE IN THE EVOLUTIONARY LIFE CYCLE F E Maturity Saturation G H Decline The Life Cycle Portfolio Matrix
Continuity Incremental Flux Global Patterns of Strategic Change
The Whole Product Model Potential Product Augmented Product Expected Product Generic Product
High quality E A High price Low price B C D Low quality The Product-Positioning Map
Environment Product Price Environment Environment Place Promotion Environment The Four P‘s of McCarthy I
High quality Marketing Mix Channels Coverage Assortments Locations Inventory Transport Place Product Product variety Quality Design Features Brand name Packaging Sizes Services Warranties Returns Target Market Low quality Promotion Sales promotion Advertising Salesforce Public relations Direct marketing Price List price Discounts Allowances Payment period Credit terms The Four P‘s of McCarthy II
Marketing activities Demand End users Manufacturer Intermediaries Push Strategy Demand Marketing activities Demand Demand End users Manufacturer Intermediaries Pull Strategy Push versus Pull Strategy
Product Price Promotion Customer Service Place People Processes The Expanded Marketing Mix
Situation (SWOT) Action plan 1 firm market industry competition environment budget allocation product promotion price distribution Objectives Forecasts Marketing Plan sales market share market expansion leadership satisfaction quantify: costs sales profits market share Strategy Control segment – target price / quality product positioning differentiation diversification organization structure measurement tools check frequency => Corrective actions 3 2 5 4 6 The 6 – Step Marketing Plan
Plan Act Do Performance Check Path of continous improvement Time The PDCA Cycle
Enterprise Management Process Decision Process Enterprise Structure Mission & Strategy Customer Satisfaction Value Improvement Enterprise Learning Benchmarking
Numerous environmental opportunities Cell 3: Supports a turnaround- oriented strategy Cell 1: Supports an aggressive strategy Substantial internal strengths Critical internal weaknesses Cell 4: Supports a defensive strategy Cell 2: Supports an diversification strategy Major environmental threats SWOT Analysis Diagram
Weaknesses Strengths Opportunities Threats SWOT Analysis I
STRENGTHS / WEAKNESSES Firm, Organization OPPORTUNITIES / THREATS Environment, Market, Industry • Market share • Key account share • Growth rate • Supply diversity • Influence • On market • Purchasing / selling deadline • New products cycles • Negotiation power • - firm suppliers • - customers • Market size • Key account size • Annual growth rate • Market diversity • Price sensitivity • Seasonality • Cycles • Negotiation power • - suppliers • - consumers MARKET COMPETITION • Firm competitivity • - Product, service • - Profitability, H.R., … • Segments invested in • Firm’s integration level • High-tech vulnerability • Competitor types • Concentration level • Intrants / extrants • Market share evolution • Vertical / horizontal integration • Technology substitution SWOT Analysis II
STRENGTHS / WEAKNESSES Firm, Organization OPPORTUNITIES / THREATS Environment, Market, Industry • Firm margins • Economies of scale • Barriers • Production capacity level • Global benefits • Economies of scale • Barriers • Production capacity level FINANCE / BUSINESS • Adaptability to change • Expertise / Know-How • Patent ownership • Production technology • Maturity / volatility • Complexity • Differentiation • Patents and copyrights • Production technology TECHNOLOGY SOCIO - POLITICAL • Reactivity / Flexibility level • Adaptability • Agressiveness • Working relationships • Attitudes / Social trends • Laws and regulations • Pressure groups • Trade union activities SWOT Analysis III
Support activities Firm infrastructure Human resource management Technology development Procurement Margin Inbound logistics Operations Outbound logistics Marketing and sales Service Margin Primary activities The Generic Value Chain I
FIRM INFRASTRUCTURE HUMAN RESOURCES MANAGEMENT TECHNOLOGY DEVELOPMENT PROCUREMENT MARGIN INBOUND LOGISTICS MARKETING & SALES OUTBOUND LOGISTICS OPERATIONS SERVICE Marketing Management Sales Force Operations Technical Literature Sales Force Administration Advertising Promotion The Generic Value Chain II
Firm infrastructure Human resources management Margin Technology development Procurement Margin Inbound logistics Outbound logistics Marketing and sales Service Operations Primary Activities The Generic Value Chain III
Current Products New Products Market penetration Product development Current Markets Market development New Markets Diversification The Ansoff Matrix I
PRODUCTS AND/OR SERVICES Existing New New product development Market penetration Existing MARKETS Market development Diversification New The Ansoff Matrix II
PRODUCTS AND/OR SERVICES Existing New Customer loyalty Customer extension Existing CUSTOMERS Customer acquisition Customer diversification New The Customer Growth Matrix
Broad Moderate Product Diversification Narrow Market Diversification Narrow Moderate Broad Product-Market Diversification
RELATIVE MARKET SHARE High Low Question Mark Star High MARKET GROWTH RATE Cash Cow Dog Low BCG’s Growth-Share Matrix I
RELATIVE MARKET SHARE High Low Question Mark Star A High Divest E B D MARKET GROWTH RATE F C Low G Divest Dog Cash Cows Targeted future position in the corporate portfolio Present position in the corporate portfolio BCG’s Growth-Share Matrix II
RELATIVE MARKET SHARE High 1.0x Low 0.1x 10x Star businesses Question marks Low MARKET GROWTH RATE 10% Cash generating businesses Dog businesses High BCG’s Growth-Share Matrix III
Stars Question Marks 22% 20% 18% 4 1 16% Market Growth Rate 3 Dogs 14% Cash Cows 2 12% 5 10% 8% 6 6% 7 4% Relative Market Share 8 2% 10 x 1 x 0.1 x BCG‘s Growth-Share Matrix IV
Small Large Fragmented Specialization Many NUMBER OF APPROACHES TO ACHIEVE ADVANTAGE Stalemate Volume Few SIZE OF ADVANTAGES The New BCG Matrix
SIZE OF THE ADVANTAGE Small Large Volume Stalemate ROI ROI Few Market share Market share NUMBER OF WAYS TO ACHIEVE COMPETITVE ADVANTAGE Specialization Fragmented ROI ROI Many Market share Market share Underlying Relationship Between ROI and Market Share in the New BCG Matrix
Structure Systems Strategy Superordinate Goals Skills Style Staff McKinsey‘s Seven ‚S‘s Framework
VISION PLANNING • Vision for Disruption • Identifying and creating • opportunities for • temporary advantage • through understanding • Stakeholder Satisfaction • Strategic Soothsaying • directed at identifying new ways to serve • existing customers better or new • customers that no one else • serves now. • Capability for Disruption • Sustaining for momentum by • developing flexible capacities for • Speed • Surprise • that can be applied across • many actions to build a series • of temporary advantages • Tactics for Disruption • Seizing the initiative to gain • advantage by • Shifting the Rules • Signaling • Simultaneous and • Sequential Strategic • Thrusts • with actions that shape, mold, or • influence the direction or nature of • the competitors‘ responses. Market Disruption RESOURCE PLANNING PUNCH-COUNTERPUNCH PLANNING Disruption and the New 7-S’s
Banner Brand Business Units Core Products (Platforms) Core Competencies Core Competencies I
Core Competencies II Processes Core Competencies Technologies Capabilities
Core Competencies III Low Company View High Competency 1 Competency 5 Competency 4 Low Market View High Competency 6 Competency 2 Competency 3