Value Stream Mapping
Value Stream Mapping. Sustainable Operations Professor Mellie Pullman. What’s in it for you?. A significant tool for improving any process, Key tool for prototyping an idea before going into action Designing a new operation, examining needed resource inputs (information, people, materials)

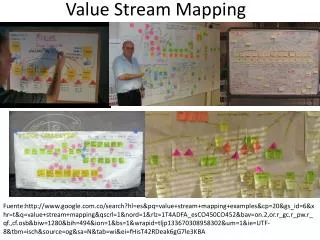
Value Stream Mapping
E N D
Presentation Transcript
Value Stream Mapping Sustainable Operations Professor Mellie Pullman
What’s in it for you? • A significant tool for improving any process, • Key tool for prototyping an idea before going into action • Designing a new operation, examining needed resource inputs (information, people, materials) • Relevant for existing operation or new operation • Evaluating each step to see if is adding value or generating waste • Determining the costs of inputs and outputs at each step • Puts new eyes on the process when you walk through and document through your map
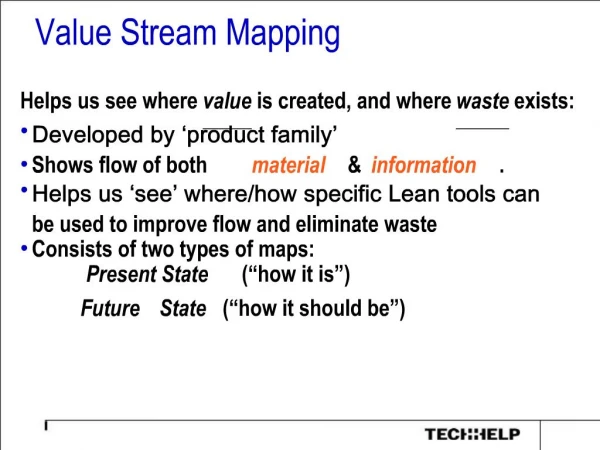
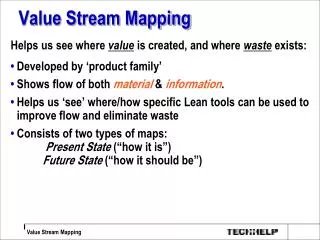
Value Stream Mapping & Analysis • Purpose: to describe a process visually to find ways of improving the current process. • Find repetitive operations • Identify potential bottlenecks • Describe directions and distances of flows (people, material and information) • Look at resource use and minimums • Create better value & reduce waste
Detailed Process Map Identifies the specific activities that make up the process. Basic steps are: Identify the entity that will serve as your focal point: • Customer? • Order, item, proposal, event package, or similar concept that passes through a series of process steps. Identify clear boundaries, starting and ending points, and lines of demarcation between customer, order, and other relevant information flows. Keep it simple • Does this detail add any insight? • Do we need to map every exception condition?
Typical Mapping Symbols or Operation (task or work activity) Inspection Decision point (typically requires a “yes” or “no”) Document or order created Delay Storage Transportation: Move Materials, customers or employees
Other Value-stream Map symbols Identifies improvement opportunity Truck Shipment External Source (suppliers & Customers) Process Process Descriptor Inputs Outputs
Map Example: Lean & CleanFinding the current state of resource use and plan for reducing it • Green Suppliers want to understand their resource and toxic material use versus the minimum required at each process (currently done at sustainably focused companies like New Belgium Brewery)
2. Identify a key resource that you would like to track (water, energy, GGE or carbon, labor, local economy contribution, value-add time) Comparing Usage to Needs Visually (bottom of map)
3. Focus on an opportunity area for improvement or Innovation for new concept developers
4. Create a process map focusing specifically on that opportunity area
5. Visualize an Improve “Future State” for the opportunity areas (brainstorm about how to do things differently)
Value add Lens:Distinguish between Value-Add and Non Value-Add Process Step • Value Add (VA) • Business Non-value-add (BNVA) • Non-value-add (NVA)
Value Add Steps • Work that contributes to what your customers want out of your product or service • Cooking a meal • Measuring & Cutting Material • A more sustainable and better life • Does it meet these criteria? • Adds a desired function, form, or feature to the product or service • Enables a competitive advantage (reduced price, faster delivery, socially sustainable) • Includes an activity that a customer would be willing to pay for or would not prefer our competitors if he/she knew we did this task and they did not.
Business Non-Value Add • Activities that your customer doesn’t want to pay for (it does not increase value in their eyes) but are required for some reason • Accounting, legal, regulatory • Is task required by law or regulation? • Does task reduce financial/liability risk? • Does task support financial requirements? • Does process break down if task is removed?
Non-value Add • Work that does not add value in the eyes of the customer and they would not want to pay for it (nor is it required for BNVA) • Rework, multiple signatures & copies, counting, handling, inspecting, set-up, downtime, transporting, moving, delaying, storage. • Environmental damage • Social injustice
Linking Processes to Value with Metrics (i.e. measures A and B) • Possible Measures or Metrics: • Link desired customer value to process • Time (measure distance traveled and task time) • Cost • Quality • Flexibility • Sustainability metrics • Set standards • Guide design of new or redesign of existing process
Mapping Exercise can lead to Potential Changes: • Raw materials • Product (output) design • Job design • Processing steps used • Management control information • Equipment or tools • Suppliers • i.e. Anything but customers may be changed unless they do not add value!!
Questions to ask to improve process • Whatdoes thecustomer need?, operations are necessary? Can some operations be eliminated, combined, or simplified? Can the product be redesigned to address an issue?... • Whois performing the job? Can the operation be redesigned to use labor better? Can operations be combined to enrich jobs? …. • Whereis each operation conducted? Can layout be improved? …. • Whenis each operation performed? Is there excessive delay or storage? Are some operations creating bottlenecks? ….. • Howis the operation done? Can better methods, procedures, or equipment be used? Can we reduce resources and toxic activity?