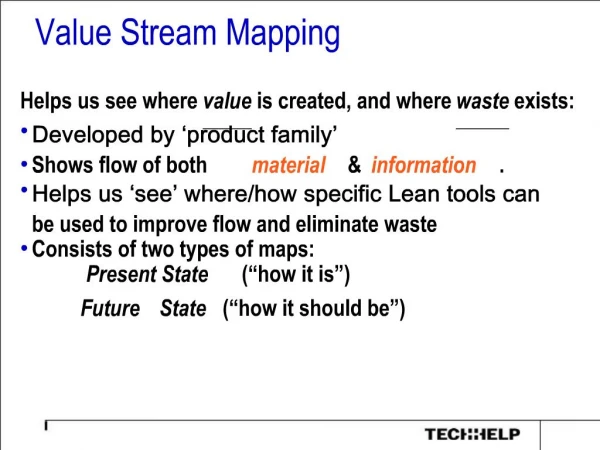
Mapping Your Value Stream
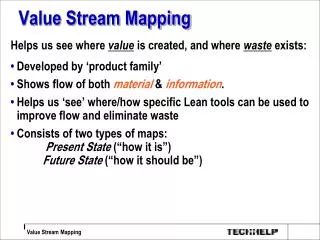
Mapping Your Value Stream. Manufacturing Insights Mapping Your Value Streams. The evolution of customer needs drives manufacturing processes and change. Value Stream Mapping helps to develop the vision. Value Stream Mapping looks at the WHOLE , not just a piece.

Mapping Your Value Stream
E N D
Presentation Transcript
Manufacturing InsightsMapping Your Value Streams • The evolution of customer needs drives manufacturing processes and change. • Value Stream Mapping helps to develop the vision. • Value Stream Mapping looks at the WHOLE, not just a piece. • Good details on how and where to start mapping. • Good commentary by James Womack.
What Did We See? • Value stream mapping shows what and where to make improvements. • Value stream mapping is a major management tool for LEAN engaged companies. • Value stream mapping doesn’t take years. • Who leads Value Stream Mapping? • Henry Ford did it in 1914 (He just didn’t know it!!)
What Did We See? (cont’d) • What caused the Donnelly Company to change? • What happened to and within the company when they adopted LEAN? • Did they use a lot of LEAN tools and concepts or just a few? • Do they believe they are finished?
Mapping YourFuture StateValue Stream Target All Waste!
Defining Kaizen CHANGE OVER Kaizen = “To Make Better” • Small incremental changes that add up to big improvements. • Usually low-cost/no-cost solutions that can be implemented every day. • Becomes a philosophical shift in doing work, constantly looking for a better way.
Types of Kaizen Activities • Reduce set-up time • Implement cellular/flow manufacturing • Conduct 5S/visual management events • Design and implement standardized work • Deploy point of use storage and Kanban replenishment systems • Cross function issues
Intangible Benefits • Trains and involves employees from all parts of the business • Creates an environment for cultural change • Increases sense of urgency • Energizes the rate of improvement • Makes people improvement-oriented • Makes improvement people-oriented
WASTE Elements of production that add time, effort, cost, but no value Things to Remember about Waste: • Waste is really a symptom rather than a root cause of the problem • Waste points to problems within the system • (At both process & value stream levels)
8 Wastes • Defects • Processing Waste • Over Production • Excess Inventory • Transportation • Motion • Wait Time • Under Utilized People
TAKT Time Synchronizes pace of assembly to match pace of sales (customer demand). Rate for assembling a product based on delivery date. Effective Working Time per shift 120 sec = = = 20 seconds Takt Time Customer Requirement per shift 6 pieces
A B C Continuous Flow Processing B C A Batch & Push Processing Process A: 10 Minutes Process B: 10 Minutes Process C: 10 Minutes Lead Time 30++ minutes for total order Continuous Flow: “Make One – Move One” 12 Minutes 3 Minutes
Build to Supermarket or to Shipping? Customer To ShippingTo Supermarket Customer Shipping Assembly Assembly Shipping Supermarket
Supermarket Pull System1) Customer process goes to supermarket and withdraws what it needs when it needs it.2) Supplying process produces to replenish what was withdrawn. ‘Withdrawal” Kanban ‘Production” Kanban Customer Process Assembly New Product Withdrawn Product Long C/O Downtime Distance Batching by type Volume fluctuation Supermarket A B C D Purpose: A way to control production between flows. Controls production at supplying process without trying to schedule.
The Future State Mapping Tool Product Family • This is your foundation (and the basis) for the future state • 70% accurate is acceptable Current State Drawing • Design the lean flow by “carving” out the waste (it is now obvious from your current state map) • The challenge is to “create flow” and minimize the “hand off’s” with your changes Future State Drawing Plan and Implementation • Develop a plan to make the new • flow a reality
FIFO Future State Icons kanban post supermarket kanban path production kanban first-in first-out flow kanban arriving in batches withdrawal Kanban withdrawal CHANGEOVER signal Kanban leveling mix and-or volume OXOX kaizen lightning burst
Class “F” Estimate process To Be 16 Oct 01As Is 30 Oct 01 Status of late estimates Information Systems AUS/NMD Bulletin Board Type Commander New AWR Weekly Metric Report Type Commander Information Production Daily Schedule Daily Schedule 46 AWRs/WK 46 AWR’s/WK APM Assigns W/1 CT=20 min Supe Assigns/ Prepare Tracker Sheet CT=10 min Planner Estimates + Updates Tracker CT=40 min APM Sends to PE CT=15 min < 8 HRS < 8 HRS <16 HRS <8 HRS LT<40 hrs <8 HRS <8 HRS <8 HRS <16 HRS =3.1% VA=75 min 1.25 hrs 20 MIN 10 MIN 40 MIN 15 MIN
Creating the Future State Map • Use your current state map as the baseline and mark it up with suggested changes • After the team has agreed on changes, draw your future state map from scratch • Format your drawing for presentation and review • Develop an implementation plan including short and long term actions
Analyze Your “As-is” Process Look for ways to: • Stop doing things which aren’t essential to colleagues or customers • Redistribute roles and tasks in a more flexible way • Change the way the task is done • Remove or reduce unnecessary authorizations/ approvals • Eliminate current process constraints
Analyze Your “As-is” Process • Where can we use continuous flow? • Where can we use supermarkets? • What are constraints to improving lead time? • How can we serve our customer better – and still go on liberty?
Implementation Plan Short Term Changes (within 30 days) • In your span of control to change Long Term Changes • Require instruction changes • Requires funding Be sure to assign a estimated completion date to each line item and who is responsible for making it happen
Process: Date: # Waste Problem Solution Who When Status A A A A A A A P P P P P P P S S S S S S S D D D D D D D Action Plan
Status • Plan • Problem has been identified, a solution proposed, action assigned and a completion date assigned. • Do • Solution has been implemented in a controlled situation. • Study • Results of solution is being evaluated with metrics. • Act • Solution is fully implemented and is sustainable.
Presenting the Future State Map • Format your presentation so that it is viewable by the entire group. • Be prepared to address the following: • What are your process constraints? • Where have you added “pull” or “flow”? • What is the resulting lead time improvement. • What are the open actions to accomplish implementation? Implementation