Value Stream Mapping
Value Stream Mapping. Presented By The University of Texas-School of Public Health.


Value Stream Mapping
E N D
Presentation Transcript
Value Stream Mapping Presented By The University of Texas-School of Public Health This material was produced under grant number SH-22316-SH-1 from the Occupational Safety and Health Administration, U.S. Department of Labor. It does not necessarily reflect the views or policies of the U.S. Department of Labor, nor does mention of trade names, commercial products, or organizations imply endorsement by the U.S. Government.
Project Funding This material was produced under grant number SH-22316-SH-1 from the Occupational Safety and Health Administration, U.S. Department of Labor. It does not necessarily reflect the views or policies of the U.S. Department of Labor, nor does mention of trade names, commercial products, or organizations imply endorsement by the U.S. Government.
Learning Objectives By the end of this module participants should be able to: Identify the definition of value stream mapping List the importance of value stream mapping Develop the value stream mapping based on the five step process for removing waste
DAY 1 1&2 Phase Define The DMAIC Process with Tools • Tools: • Voice of Customer (VOC) Analysis • Process Mapping • Value Stream Mapping Measure Analyze Improve Control
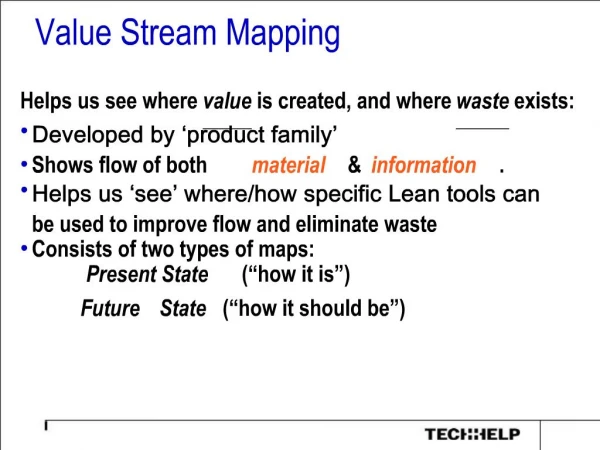
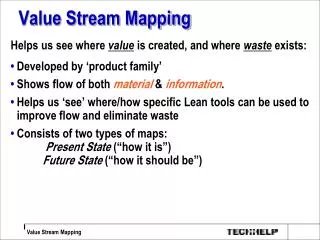
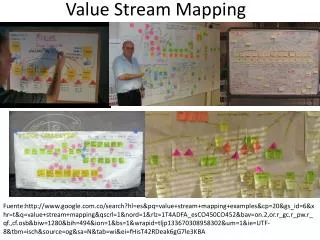
Value Stream Map FTEs Cycle Time Volume Value Stream Map What is Value Stream Mapping? A pictorial representation of the Flow of Material,People and Processes Information Specific data associated with each step Touch Time and Cycle Time Volume Resources Errors/rework
Why is Value Stream Mapping important for assessing current state? Characteristics of Value Stream Map Possible benefits Root causes identified and linked to specific Process Steps Root causes of lengthy Throughput times diagnosed Prioritized process improvements • Delineation of Process Steps and sequence of steps • Description of bottlenecks and queues within process • Match of specific resources and costs to each Process Step
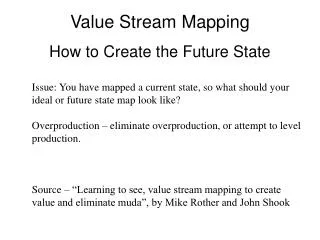
Five Step Process For Removing Waste Map the “As Is” State 2. Map the “Ideal Future” State 3. Identify gaps between “As Is” State and “Ideal Future” State 4. Make the selected changes. Evaluate the improvement. This is the “Target State” 5. Design continuous improvementprocess
Step 1 – Map the “As Is” State Case Example – Sales Order Processing For A PC Retailer Time Customer is On Telephone Initial Phone Contact Wait for Available Sales Person Fill Out Order Form Sales Pitch Configure System Promise to Ship C/T = 5 minutes W/T = 0 VA/T = 0 C/T = 10 minutes W/T = 10 minutes VA/T = 10 minutes C/T = 30 minutes W/T = 30 minutes VA/T = 5 minutes C/T = 10 minutes W/T = 10 minutes VA/T = 5 minutes C/T = 5 minutes W/T = 5 minutes VA/T = 0 Time = 0 Change Ship Date Triggering Event No Issue Work Order to Factory Floor Check Availability of Materials Batch Together Similar Systems Pending Order “FIFO” Queue Yes Mtl. Available ? Measurable Deliverable C/T = 1 Day W/T = 1 hour VA/T = 15 min C/T = 3 Days W/T = 1 hour VA/T = 0 C/T = 6 Days W/T = 1 Day VA/T = 0 C/T = 7 Days W/T = 0 VA/T = 0 While customer is on telephone: C/T = 60 min. W/T = 55 min. VA/T = 20 min. From Contact to Order Launch: C/T = 17 days W/T = ~1 day VA/T = 15 Min
Time Customer is On Telephone A Contact Wait for Available Sales Person Sales Pitch Configure System Fill Out Order Form Promise to Ship C/T = 0 W/T = 0 VA/T = 0 C/T = 10 minutes W/T = 10 minutes VA/T = 10 minutes C/T = 30 minutes W/T = 30 minutes VA/T = 5 minutes C/T = 5 minutes W/T = 5 minutes VA/T = 0 C/T = 5 minutes W/T = 0 VA/T = 0 C/T = 10 minutes W/T = 10 minutes VA/T = 5 minutes Change Ship Date No Pending Order “FIFO” Queue Batch Together Similar Systems Check Availability of Materials Issue Work Order to Factory Floor Yes Mtl. Available ? C/T = 7 Days W/T = 0 VA/T = 0 C/T = 6 Days W/T = 1 Day VA/T = 0 C/T = 3 Days W/T = 1 hour VA/T = 0 C/T = 1 Day W/T = 1 hour VA/T = 15 min Step 2 – Map the “Ideal Future” State Case Example – Sales Order Processing For A PC Retailer (Cont’d) Gold – Greatest Potential Impact Gray – Worthwhile Opportunity
Step 3 – Identify gaps between “As Is” State and “Ideal Future” State Case Example – Sales Order Processing For A PC Retailer (Cont’d) Time Customer is On Telephone A Contact Wait for Available Sales Person Sales Pitch Configure System Fill Out Order Form Promise to Ship C/T = 0 W/T = 0 VA/T = 0 C/T = 10 minutes W/T = 10 minutes VA/T = 10 minutes C/T = 30 minutes W/T = 30 minutes VA/T = 5 minutes C/T = 5 minutes W/T = 5 minutes VA/T = 0 C/T = 5 minutes W/T = 0 VA/T = 0 C/T = 10 minutes W/T = 10 minutes VA/T = 5 minutes Change Ship Date No Pending Order “FIFO” Queue Batch Together Similar Systems Check Availability of Materials Issue Work Order to Factory Floor Yes Mtl. Available ? C/T = 7 Days W/T = 0 VA/T = 0 C/T = 6 Days W/T = 1 Day VA/T = 0 C/T = 3 Days W/T = 1 hour VA/T = 0 C/T = 1 Day W/T = 1 hour VA/T = 15 min Gold – Greatest Potential Impact Gray – Worthwhile Opportunity
Step 4 – Make the selected changes Case Example – Sales Order Processing For A PC Retailer (Cont’d)
Step 4 – (Cont’d) (Evaluate the improvement) Case Example – Sales Order Processing For A PC Retailer (Cont’d) Time Customer is On Telephone Initial Phone Contact Fill Out Order Form (& Config. System) Wait for Available Sales Person Promise to Ship Sales Pitch Configure System Mtl. Available ? Yes C/T = 5 minutes W/T = 5 minutes VA/T = 0 C/T = 30 minutes W/T = 30 minutes VA/T = 5 minutes C/T = 30 minutes W/T = 30 minutes VA/T = 10 minutes C/T = 5 minutes W/T = 0 VA/T = 0 C/T = 10 minutes W/T = 10 minutes VA/T = 10 minutes C/T = 0 W/T = 0 VA/T = 0 No Reconfigure? Optimize Product Mix Check Availability of Materials Issue Work Order to Factory Floor Pending Order “FIFO” Queue C/T = 3 Days W/T = 1 hour VA/T = 0 C/T = 6 Days W/T = 1 Day VA/T = 0 C/T = 7 Days W/T = 0 VA/T = 0 C/T = 1 Day W/T = 1 hour VA/T =15 min Improvement Targets – As-Is Target As-Is Target While customer is on telephone: From Contact to Order Launch: C/T = 60 min. W/T = 55 min. VA/T = 20 min. 45 min. 45 min. 20 min. C/T = 17 days W/T = ~1 day VA/T = 15 min 7 days ~1 day 15 min
Step 5 – Design continuous improvement process Case Example – Sales Order Processing For A PC Retailer (Cont’d) • Institutionalize the gain. • Make sure that the improvement does not decay. • Automated systems (Mistake Proofed) • Templates • SPC to control inventory
How do you create a Value Stream Map? Helpful hints for initial drafts: Steps: Everyone involved should draw their own map (ensures understanding of the complete process) Draw in pencil (easy to change and reliable) and avoid using computers (time-consuming) Bring a stopwatch and verify all times Use standard measurements View the work unit processes from the customer’s perspective by walking from the point where the work unit delivers a product or service to a customer and walk backwards Include exception processing and fixing errors • 1. Walk through the work unit area to determine the primary material and information flows • 2. Draw the Value Stream Map using the list of standard icons to depict flows • 3. Use a list of key process measurements and questions to assist in developing the map • 4. Return to work unit area as necessary to get more detailed data
Value Stream Map Key process measurements. Description Measurement Number of distinct types of products in each process step Time elapsing between 1 completed item and the next completed item (includes wait time) Time spent by the item in a queue The time an operator actually touches the item (touch time) Time from last good piece of one product (or service) to the first good piece of the next product (or service) Maximum theoretical time for each step (minus break, meeting, and clean up) Actual amount of time available to process items Product variations Cycle Time* (C/T) Wait Time* (Wait) Value Add Time* (VA/T) Setup Time* (S/T) Working Time (W/T) Uptime Capture StDev and average *Time for all steps measured in days/hours/minutes/seconds
Value Stream Map Key process measurements. Description Measurement Number of FTEs Number of shifts Rework rate Queue size (Q) Distance traveled (D/T) Machine capacity (M/C) • People available to fully operate a process step per shift • Number of shifts per day • Percent of items subject to rework as a result of that unit • Number of items waiting for next process step • Distance for transfer of material, paperwork, etc. • Maximum number of items processed per hour per machine, e.g., fax or scanner Capture StDev and average
Start time: _____________ Distance from last queue (if applicable): __________ Process step: _________________________ End time: _____________ 1. _____________ 2. _____________ 3. _____________ 4. _____________ 5. _____________ _____________ _____________ _____________ _____________ _____________ Value Add/Touch time (minutes): _______________________ Type of Patient Move/Transfer:: ________________ Distance to next step (feet): __________________ Wait time in/between Steps (minutes): _______________________ Value Stream Map Process Step Worksheet Activity Number of Workers/FTEs
Diagnostic Questions Strategies for Value Stream Map Diagnostic Questions Signs Of Opportunity Value Stream Element Materialflow • How many people touch the item during its time in your work group? • Do you take “expedite” or “rush” requests? How are these handled compared to how other requests are handled? • Do you receive different types of work? Is the employee effort needed to complete different types of work significantly different? • How often do you receive work that should have been sent somewhere else? What do you do with it when you receive it? How long does that take? • Multiple hand-offs for seemingly “simple” processes • Presence of any sort of “rush” process outsidethe norm • Work varies widely, along with effort required • A lot of misdirected-sent work or a lot of time spent handling misdirected work (even if the volume is small)
Diagnostic Questions Strategies for Value Stream Map Diagnostic Questions Signs Of Opportunity Value Stream Element Do you know what tasks the groups ahead and/or behind yours in the work stream perform on the item? Little knowledge of or concern for tasks performed by other areas Process flow What role does quality play in your process? When is it assessed? How is it measured? How are defects corrected? Where do defects come from? Quality not tracked, quality checked at end of process only, steps where “checkers check checkers,” time to correct defects come from “line” workers; many defective products arrive in the area from outside Quality
Diagnostic Questions Strategies for Value Stream Map Diagnostic Questions Signs Of Opportunity Value Stream Element Process flow Do you know what tasks the groups ahead and/or behind yours in the work stream perform on the item? Little knowledge of or concern for tasks performed by other areas Quality What role does quality play in your process? When is it assessed? How is it measured? How are defects corrected? Where do defects come from? Quality not tracked, quality checked at end of process only, steps where “checkers check checkers,” time to correct defects come from “line” workers; many defective products arrive in the area from outside
Diagnostic Questions Strategies for Value Stream Map Diagnostic Questions Signs Of Opportunity Value Stream Element No tracking or very wide distribution of productivity Little or no cross-training Many cuts of work groups and lots of silos created Wide ranges in education or salary with little variation in job description or skill set needed Do you track individual productivity? If so, is the performance band around the mean narrow or wide? Are your workers trained to do more than one job within your area? Along what lines do you divide your workforce? What is the span of education level and salary in your work group? Do the skills required to perform the different functions vary greatly? Resources
Diagnostic Questions Strategies for Value Stream Map Diagnostic Questions Signs Of Opportunity Value Stream Element Queues • Does the work enter the process in large batches or in small batches? What is the size of a batch? Doesthe work move through the processin small or large batches? • Do you frequently have backlogs? What causes them? • Work enters and/or moves through the process in large batches • Frequent backlogs; intentional backlogs to “keep people busy” Do your workers communicate across functions? If so, what methods do they use? How do they know when to begin and end their work? Little communication across functions; each group works as hard as it can without regard to progress of other groups Information flows
Spaghetti Chart Before Obtain a layout List the steps in the process Draw the path of the process from start to finish on the layout exactly as the material flows, not “as it should flow” Multiple products or services plotted on the same chart will clearly show any interference/confusion (use multiple colors) Examine the patterns or paths
Spaghetti Chart After Spaghetti diagrams can clearly illustrate the inefficiencies in a process related to physical movement. Places where work can be simplified will almost “jump off the page.” Examples of Spaghetti Charts include: Movement of people walking around Movement of materials through an area Movement of hands performing a series of operations Movement of documents through an office
Standard Work Sheet Write on Board Standard Work Sheet Process Date Prepared May 20 03 Name or Revised / / Model Step 1 Department Department From Scope of Number Head Supervisor Operations Step 7 Model To Name Board Chair Identify each machine & significant work area in scale (1ft per Square) Draw a circle with a number in it for each standard sequence of steps Show a path of operator Safety Standard Work # of Pieces of Operator Show path of work in Process Quality Check Precaution in Process Std WIP Takt Time Net Time Number 1 26 sec 30 sec 1
Summary • Value steam mapping is a pictorial representation of the flow of material, people and processes information. • Value stream mapping important for assessing current state. • Spaghetti diagrams can clearly illustrate the inefficiencies in a process related to physical movement. • Five Step Process For Removing Waste • 1. Map the “As Is” State • 2. Map the “Ideal Future” State • 3. Identify gaps between “As Is” State and “Ideal Future” State • 4. Make the selected changes. Evaluate the improvement. This is the “Target State” • 5. Design continuous improvement process