Download
1 / 14
140 likes | 345 Vues
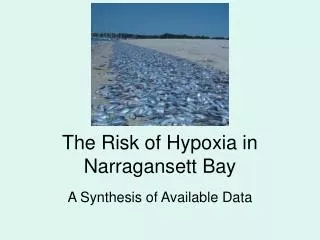
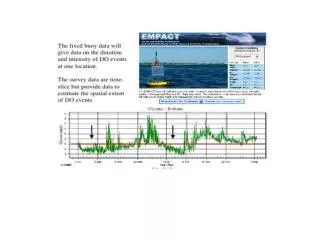
Pollution Risk Analysis of Narragansett Bay. A GIS Research Project by Matt Dobbin. Motivations. Grew up in Rhode Island right on Narragansett Bay. Beautiful place to visit, vital tourist attraction.

E N D
Pollution Risk Analysis of Narragansett Bay A GIS Research Project by Matt Dobbin
Motivations • Grew up in Rhode Island right on Narragansett Bay. • Beautiful place to visit, vital tourist attraction. • Member of the Surfrider Foundation, actively participate in water quality testing at local beaches and ponds. • Incredibly diverse array of wildlife hinges upon Bay health.
Data/Methods • Downloaded Necessary Layers • S44llu95: land coverage for RI. • BASINS: polygon layer of river drainage basins in Rhode Island. • SHELLCL: polygon layer of shellfish closure areas. • CERCLIS: point layer of hazardous waste containment sites. • LUSTS: point layer of sites where hazardous waste leaks/spills have occurred. • SEWOFLO: point layer of sites where sewage overflow occurs.
Methods • Dissolved BASINS layer based on major basins. • Performed multiple point-polygon joins to determine number of hazardous waste sites in each basin and area. • Performed raster analysis on land use layer using different basins as a mask. • Added SHELLCL layer and performed spatial join with each different hazardous waste site.
Methods • Problem: land cover layer was divided into over 60 different land cover categories. • Land cover layer was very precise • Initial map appeared completely black. • Consulted metadata. Arranged color ramp jenks according to larger land cover groupings.
Findings • A large proportion of hazardous waste sites are located in the northeastern quadrant of Rhode Island in close proximity to the very tip of Narragansett Bay.
Findings • The areas of land closest to the Bay area are highly urbanized, particularly in the Northeast quadrant of the state.
Findings • The Narragansett Bay Drainage Basin is both highly urbanized, and contains a surprising amount of hazardous waste sites.
Findings • Highly urbanized land composition of Narragansett Bay Drainage Basin.
Findings • Relative pollution levels and areas of highest toxicity are reflected by areas of shellfish closure. • Most highly effected area is the very tip of Narragansett Bay/Providence Harbor area.
Findings • This research shows that the Narragansett Bay Drainage Basin is an area that has a strong influence on overall cleanliness of the entire Bay area. • This particular area has definitely already influenced pollution levels of the surrounding waters, and poses great potential to do so in the future. Large number of hazardous containment sites may experience leaks or spills due to apparatus degradation. • The northeast quadrant of Rhode Island poses particularly serious threats to the Bay. Controlling pollution levels originating from this area could perhaps drastically reduce pollution levels for the entire Bay.
Final Comments • Use of this paper as a tool for conservationists so that energy can be focused on areas that exert a strong influence on the Bay. • More money: Concentration of research on a microscopic scale; streams, marshes, industrial pollution analysis. Complete analysis of every aspect of the bay. • Formulation of an accurate pollution flow model. • Error: all layers were created in 1995, nominal change most likely has occurred. Digitizing error, user error. • Project gave me an intimate view of the place in which I live. • Realized the dynamics of pollution in the Bay, realized the importance some places can have on water quality, discovered the effect that decades of careless human living can have on a valuable natural resource.