Download
1 / 12
130 likes | 356 Vues
Narragansett Bay Environmental Monitoring. Li-Ling Yang Roger Williams University. Research Focus. What are seasonal fluctuations of nitrate in Narrag an sett Bay and the processes that may affect these fluctuations ?. Context :. Brief History of Narragansett Bay

E N D
Narragansett Bay Environmental Monitoring Li-Ling Yang Roger Williams University
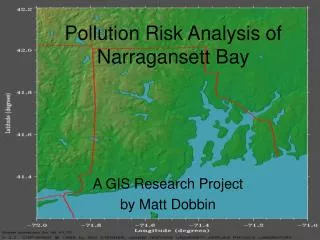
Research Focus • What are seasonal fluctuations of nitrate in Narragansett Bay and theprocesses that may affect these fluctuations?
Context: • Brief History of Narragansett Bay 1901- The Providence Sewage Treatment System is put into operation. 1910- Providence's sewage treatment plant begins to run into problems due to inadequacies of the chemical precipitation process and the continuing growth of the City. 1970's- In the absence of a continuous maintenance program, the condition of the FieldPoint plant declines to the point where nearly 65 million gallons of untreated or partially treated sewage flow into Rhode Islandwaters everyday
Context (Cont’d) • Brief History of Narragansett Bay (Cont’d) 1973- The US EPA orders the City of Providence to address the chronic pollution problem associated with the aged FieldPoint WWTF and CSO discharges, which violate the Clean Water Act. 1979- Governor Garrahy creates a Governor's Sewerage Facilities Task Force to address the EPA mandates. 1999-2001- RIDEM reviews and approves the NBC Combined Sewer Overflow Abatement Plan, a 3-phase, 20-year comprehensive project to end CSO discharges into Upper Narragansett Bay.
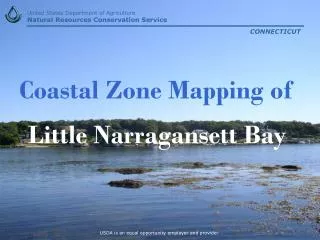
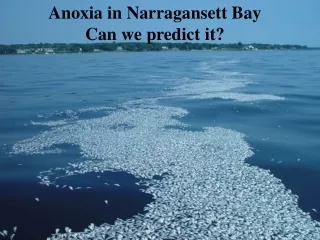
Context: • Significance of Monitoring Narragansett Bay Nutrient Concentrations and Water quality • Tidal wetlands are dynamic ecosystems of high biological productivity thatprovide essential habitats for fish, birds, amphibians and many species of invertebrates. However, they are among some of the ecosystems most affected by human activities. • Narragansett Bay, a bay and estuary on the north side of Rhode Island Sound which forms New England's largest estuary,is one such example. • Successful restoration andpreservation efforts therefore require a careful evaluation of historic patterns of changealong with continuous, long-term monitoring programs.
Method • Define a problem to be investigated • Get familiar and describe the study area by visiting Narragansett Bay Commission website http://www.narrabay.com/ • Hypothesis what processes may affect nitrate concentrations and transport in Narragansett Bay • Locate the six monitoring stations in Narragansett Bay on the map by visiting the website of National Estuarine Research Reserve System’s Centralized Data Management Office http://cdmo.baruch.sc.edu/QueryPages/viewstations.cfm?Site_ID=nar
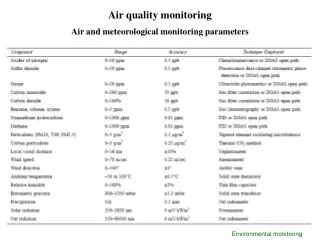
Method (Cont’d) • Get familiar with the archived and near-real time water and nutrient datafrom the different stations • Plot nitrate, water depth, salinity and temperature measured at one of the stations during 2006 for thefollowing dates: January 9-14, March 9-14, June 9-14 and September 9-14. • Examine the graphs and see if there is any rhythmic or consistent pattern. Pay attention to the differences in the trends observed between the different months.
Data Summary • Temperature and nitrate charts display reverse trends. • Salinity and Nitrate charts display somewhat similar trends. • No clear relationship is shown between the depth and nitrate concentration.
Conclusion • Certain relationships could be found between nitrate concentrations and some water data in Narragansett Bay.
Implications • Based on the findings, predict and draw a map of how nitrate enters andcirculates through the Narragansett Bay. • Use the data set available in the website of National Estuarine Research Reserve System’s to support or refute your predictions. Redraw the map according to your findings.
Educator Implications • Walk students through the data cleaning process. Different data sets might have different formats, time ranges, etc.