Download
1 / 15
150 likes | 305 Vues
United States Department of Agriculture Natural Resources Conservation Service CONNECTICUT. Coastal Zone Mapping of Little Narragansett Bay. USDA is an equal opportunity employer and provider. Coastal Zone Mapping of Little Narragansett Bay.

E N D
United States Department of Agriculture Natural Resources Conservation Service CONNECTICUT Coastal Zone Mapping ofLittle Narragansett Bay USDA is an equal opportunity employer and provider.
Coastal Zone Mapping of Little Narragansett Bay • Soil … is a natural body that occurs on the land surface … and is characterized by [either] Horizons,or layers, that are distinguishable from the initial material as a result of additions, losses, transfers,and transformations of energy and matter, or • The ability to support rooted plants in a natural environment.
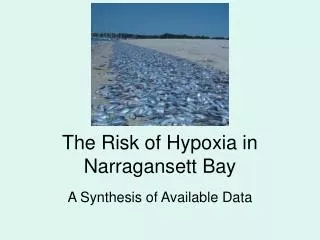
Coastal Zone Mapping of Little Narragansett Bay Tidal Marsh Submerged Tidal Marsh The upper limit of soil is the boundary between soil and air, shallow water, live plants, or plant materials that have not begun to decompose. The lower limit of soil has been arbitrarily set at 200 cm for classification purposes. The horizontal boundaries of soil are areas where the soil grades into deep water (typically 2.5 meters deep), barren areas, rock, or ice.
Coastal Zone Mapping of Little Narragansett Bay The geographic focus of this project is in the ecologically significant estuary of Little Narragansett Bay. This area encompasses approximately 2500 acres and contains subaqueous soils formed from a variety of parent materials and aquatic environments.
Coastal Zone Mapping of Little Narragansett Bay NRCS, a member of the National Cooperative Soil Survey, is the lead federal agency for the mapping and interpretations of the nation’s soil resources. The well established standards, techniques, and protocols used to map and interpret the nation’s soil resources have been applied to this project.
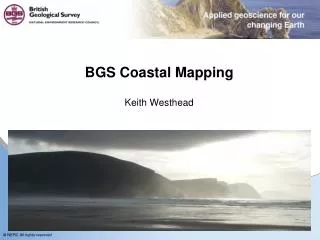
Coastal Zone Mapping of Little Narragansett Bay Soil scientists use bathymetric data to produce a contour map from which subaqueous landforms can be identified and delineated to begin the soil survey. Bathymetry is developed using a fathometer and survey equipment. Existing bathymetric maps such as this NOAA chart can also be used.
Coastal Zone Mapping of Little Narragansett Bay Subaqueous landforms are identified and delineated to predict and explain soil distributions. Due to overlying water, the identification and delineation of submerged landscape units is somewhat more complicated than that of terrestrial landscapes.
Coastal Zone Mapping of Little Narragansett Bay Bucket augers and McCauley peat samplers were used to investigate soil morphology.
Coastal Zone Mapping of Little Narragansett Bay Vibracore and push tube techniques are used to obtain minimally disturbed samples for detailed descriptions and sampling of typical pedons. The URI Graduate School of Oceanography captured these soil cores.
Coastal Zone Mapping of Little Narragansett Bay Soil cores are described and samples are sent to our National Soil Survey Center, in Lincoln, Nebraska, for laboratory analyses. Soil samples are shipped and stored cold until lab tests are completed. Upon exposure to air, the sulfides oxidize and lower the pH by creating sulfuric acid. This also affects the measurement of salinity and percent clay. Photographs of three vibracores taken from Little Narragansett Bay. From left - the Napatree, Anguilla, and Rhodesfolly tentative series.
Coastal Zone Mapping of Little Narragansett Bay The result of this endeavor is a detailed seamless soil map extending from the land into the estuary identifying subaqueous soil resources at a scale of 1:12,000.
Coastal Zone Mapping of Little Narragansett Bay Many important subaqueous soil interpretations have been identified and can be developed.
Coastal Zone Mapping of Little Narragansett Bay If a soil containing sulfidic materials is drained or if sulfidic materials are otherwise exposed to aerobic conditions, the sulfides oxidize and form sulfuric acid. The pH value, which normally is near neutral before exposure, may drop below pH 4, making the soil unsuitable for many uses.
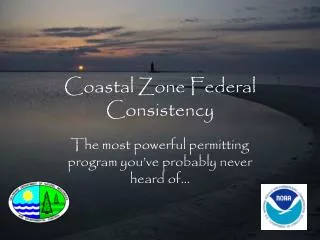
Coastal Zone Mapping of Little Narragansett Bay Ecologically meaningful characterization of important shallow water habitats, particularly interpretations necessary for eelgrass or shellfish restoration can be produced from this survey.
Ultimately, new partners and stakeholders will be engaged in the National Cooperative Soil Survey efforts of mapping subaqueous soils in coastal zone areas such as Little Narragansett Bay.