West Nile Virus: DYCAST spatial-temporal model
690 likes | 988 Vues
West Nile Virus: DYCAST spatial-temporal model. Why spatial is special. Modifiable area unit problem (MAUP) Results of statistical analysis are sensitive to the zoning system used to report aggregated data

West Nile Virus: DYCAST spatial-temporal model
E N D
Presentation Transcript
Why spatial is special • Modifiable area unit problem (MAUP) • Results of statistical analysis are sensitive to the zoning system used to report aggregated data • Results of statistical analysis are sensitive to the scale at which the analysis are performed • Examine sensitivity of results to MAUP • Boundary problem • Study areas are bounded and results just outside the study are can affect results. • Size and shape can affect results • Migration • Rhode Island (xs) • Tennessee (xl) • Ohio (jr)
Why spatial is special (cont.) • Spatial sampling • Space can be used as a means of stratification • Spatial autocorrelation • Refers to the fact that values of phenomena close in space are related • Problem: Implication for sampling is that samples close in space may not be independent • Spatial autocorrelation can be calculated and variances can be adjusted accordingly • Prospects: spatial autocorrelation can be used to estimate values at unknown locations based on surrounding know points (interpolation).
Why spatial is special (cont.) • Data management • Editing • Editing of spatial data is a long transaction • User needs to “check out” a region for extended periods of time • Other users need access • Spatial databases are version managed to permit multiple long-transaction editing • Access • Indexes are spatially based • Quad-tree recursive algorithm • Addition of temporal dimension requires a second index. Optimization of spatial-temporal searching is still a topic under research
Map to Geographic Information Systems (GIS) • Maps as layers of geographic information • Desire to ‘automate’ map • Evolution of GIS • Create automated mapping systems • Analyze geographic relationships • Model real-world phenomena
What is GIS? • Component definition: set of subsystems for the input, storage, transformation and retrieval of geographic data. • Tool definition: measuring and analyzing aspects of geographic phenomena and processes. • Model definition: a model of the real world.
GIS: It’s about • Modeling and analyzing relationships and processes that occur across space,time and different scales. • New tools for modeling • Geo-statistical procedures (Dead Crows) • Object-based GIS (Tiger model) • Seamless geographic databases (Big Apple)
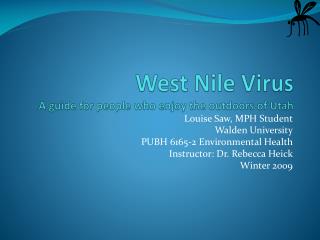
Global issues and motivation • Hundreds Dead • Thousands Infected and Sick. Sickness can last for months and result in long term neurological problems. • Threatening the blood supply. One of the most common pathogens. • Kills wildlife and threatens ecological balance. • Remediation can cause problems.
Diffusion of West Nile Virus in Birds, USA Jan 1, 1999 to Dec 31, 1999
Diffusion of West Nile Virus in Birds, USA Jan 1, 2000 to Dec 31, 2000
Diffusion of West Nile Virus in Birds, USA Jan 1, 2001 to Dec 31, 2001
Diffusion of West Nile Virus in Birds, USA Jan 1, 2002 to Dec 31, 2002
Diffusion of West Nile Virus in Birds, USA • Jan 1, 2002 to Dec 31, 2002 Jan 1, 2003 to Dec 31, 2003
Diffusion of West Nile Virus in Birds, USA Jan 1, 2004 to Dec 31, 2004
Diffusion of West Nile Virus in Birds, USA Jan 1, 2005 to Dec 31, 2005
Diffusion of West Nile Virus in Birds, USA Jan 1, 2006 to Dec 31, 2006
Diffusion of West Nile Virus in Birds, USA Jan 1, 2007 to Sept. 25, 2007
Confronting the problem at hand • Newly introduced infectious agent arrives in New York City • Observations • Wildlife are killed especially birds • Individuals become sick in close geographic proximity • Seasonal effect
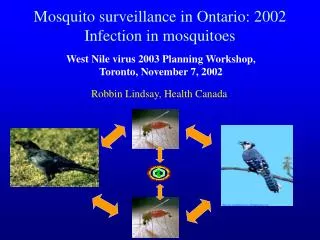
Synthesizing a hypothesis: literature review • What do we know about this disease from other parts of the world? • Outbreaks have been observed for decades in the Middle East, Africa and Europe • Mosquitoes are the vectors • These mosquitoes tend to be ornithophilic • Birds play a primary role as the reservoir host • Amplification cycle and spillover
Synthesizing a hypothesis: local observations and experience • Many birds die prior to human onset • Most are resident Passerines particularly Corvids • Patterns of birds deaths tend to be highly localized and dynamic • Human infections tend to follow these patterns of bird deaths
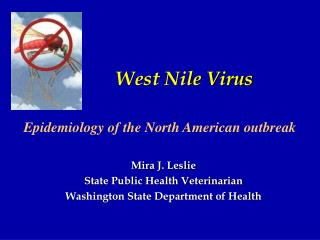
Spillover effect hypothesized by some researchers Source: The Centers for Disease Control and Prevention; http://www.cdc.gov/ncidod/dvbid/westnile/cycle.htm
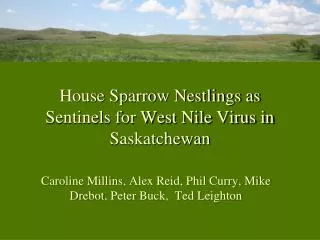
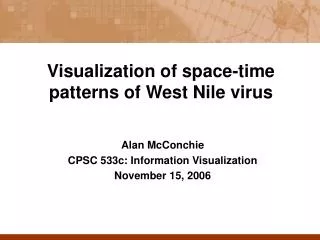
Birds • Resident, wild passerine birds act as the principal amplifying hosts of West Nile virus. • Data from Komar (2003) • Crows suffer highest casualties. 82% dead in Illinois, by 2003. • The nature of the bird as a reservoir for WNV transmission is still! under investigation. Photo Source: Ornithology and MammalogyDepartment, Cornell University
Birds continued Data Source: Komar, N. unpublished. Used with permission
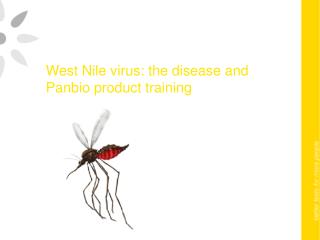
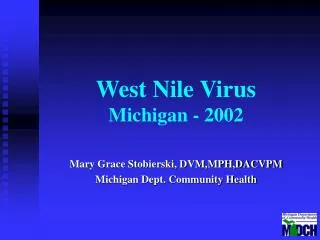
Mosquitoes Photo source: Iowa State University online image gallery • Culex pipiens: • The most common pest mosquito in urban and suburban settings. • An indicator of polluted water in the immediate vicinity. • Recognized as the primary vector of St. Louis encephalitis (SLE). • Is normally considered to be a bird feeder but some urban strains have a predilection for mammalian hosts and feed readily on humans. (American Hybrids?). • Extrinsic incubation period of 4-12 days. • Species identified in transmission in NYC include: Culex pipiens, Culex restuans, Culex salinarius and Aedes vexans.
Hypotheses • Primary Hypothesis: Dead birds are an integral part of the process that results in human infection. • Sub goals • How do we quantify dead bird activity? • How can we establish the relationship between dead birds and human infection? • Is there a statistical procedure that mirrors the process governing this relationship? • Are the statistical measures adequate?
Quantifying WNV dead bird activity. • Point Indicators of WNV • Laboratory Confirmation in Birds-Mosquitoes • Temporal lag between laboratory detection of positives and actual presence of virus in the wild. • Does not allow for early identification of amplification cycle. • Point data, no continuity in space.
Quantifying WNV dead bird activity. • Area estimates of WNV infection • Density of Dead Crows and Blue Jays • Arbitrary thresholds. • Surveillance bias. • Modifiable Areal Unit Problem (MAUP). • Data regarding the ecology of the disease ignored.
Quantifying WNV dead bird activity.DYCAST Analysis (Dynamic Continuous Area Space Time Analysis) • Assumptions: • Good surveillance design and adequate public participation in reporting. • Persons are infected at place of residence. • Non-random space-time interaction of bird deaths attributed to WNV. • WNV is continuous across space.
Quantifying WNV dead bird activity.DYCAST Analysis (contd.) • Model Components • Space-time correspondence of the death of birds as amplification measure. • Knox method (statistical) • Run Knox as an interpolation function to estimate a surface of WNV activity . • Calibrate the model using ecological information and statistical analysis. • Dynamic: Use a moving window for the temporal domain.
Quantifying WNV dead bird activity.Statistical Approach. • MEASURES OF SPACE TIME INTERACTION • THE KNOX TEST (1963) Where: N : the total number of pairs that can be formed from: n data points Where: T: the test statistic tij: the distance between points i and j: 0 if greater than the critical distance, 1 otherwise sij: the time between points i and j: 0 if greater than the critical time, 1 otherwise Where: cell o11 is T, close in space and time cell o21 are the pairs close in space only (not in space and time) cell o12 are the pairs close in time only (not in space and time) cell O22 are pairs not close in space nor time
Quantifying WNV dead bird activity.Significance Testing • Poisson • P(X T) = 1 - • Chi-Square • P(X T) = • where: Oij = O11, O12, O21, O22 of the Knox matrix • Monte Carlo: Space-Time Label switching. • Monte Carlo: Completely random seeding in space and time.
Random Monte Carlo Simulations Sweep the cylinder with a smaller cylinder of closeness in search for close pairs. 3 days 0.25 m Randomly seed the cylinder with X number of points. i.e. 10 1.5 m Count the number of pairs that can be formed from the points that fall in the smaller cylinder of closeness. Also keep track of close-space, close-time pairs. 21 days Repeat 5000 times.
Methodology • Calibration Methodology • Home address of humans testing positive considered the most definitive location of WNV existence. • Calibration date assumed to be 7 days before symptoms onset for each case. • Spatial and temporal domains of 1.5 miles and 21 days were chosen based on ecological factors. • Close space/time values were chosen from an ecologically relevant range (.25-.75 miles/3-7 days).
Methodology • Spatial Design-Prospective Surveillance • Overlay Grid (0.5 x 0.5 miles ) across NYC and Chicago and run Knox test at centroid of grid cells (each as a potential human case) on a daily basis for the year 2001 season, using all birds except pigeons.
Result evaluation • Ran for NYC in 2001 • not sufficient number of human cases to quantify. • Chicago: 215 human cases. • Rate of success. • Kappa index of agreement. • Chi-Squared test.
CHICAGO 2002 • Unconditional Monte Carlo