
SlideServe
Menu
Préférences
© SlideServe · v2026

Analysis of Solar Activity and Magnetospheric Data Correlations

druce avatar
1 diapositives · 140 Views · Sep 15, 2014

This project focuses on analyzing solar flux variations (F10.7) and their correlation with sunspot numbers and ionospheric F2 layer densities (foF2). Students will gather F10.7 data from SPDF/OMNIweb, sunspot numbers from NGDC/NOAA, and foF2 data from the UKSSDC. Additionally, the project involves examining solar wind data in the ion foreshock region, including magnetic field wave analysis and magnetospheric ion flux variations. The objective is to determine wave propagation direction, polarization, ellipticity, and boundary motion speed, with emphasis on avoiding contamination from solar events.
Analysis of Solar Activity and Magnetospheric Data Correlations - slide 1
01 / 1Analysis of Solar Activity and Magnetospheric Data Correlations
1 / 17

Télécharger la présentation

Analysis of Solar Activity and Magnetospheric Data Correlations
Une image / un lien ci-dessous est fourni (tel quel) pour télécharger la présentation

Politique de téléchargement : le contenu du site vous est fourni TEL QUEL pour votre information et votre usage personnel ; il ne peut être vendu, concédé sous licence ni partagé sur d’autres sites sans l’accord de son auteur.Le contenu vous est fourni TEL QUEL, pour votre information et votre usage personnel uniquement. Téléchargez la présentation en cliquant sur ce lien. Lors du téléchargement, si vous ne parvenez pas à télécharger une présentation, l’éditeur a peut-être supprimé le fichier de son serveur.Pendant le téléchargement, si vous ne parvenez pas à obtenir une présentation, le fichier a peut-être été supprimé par l’éditeur.

F I N

Plus de contenu associé

Transcription de la présentation
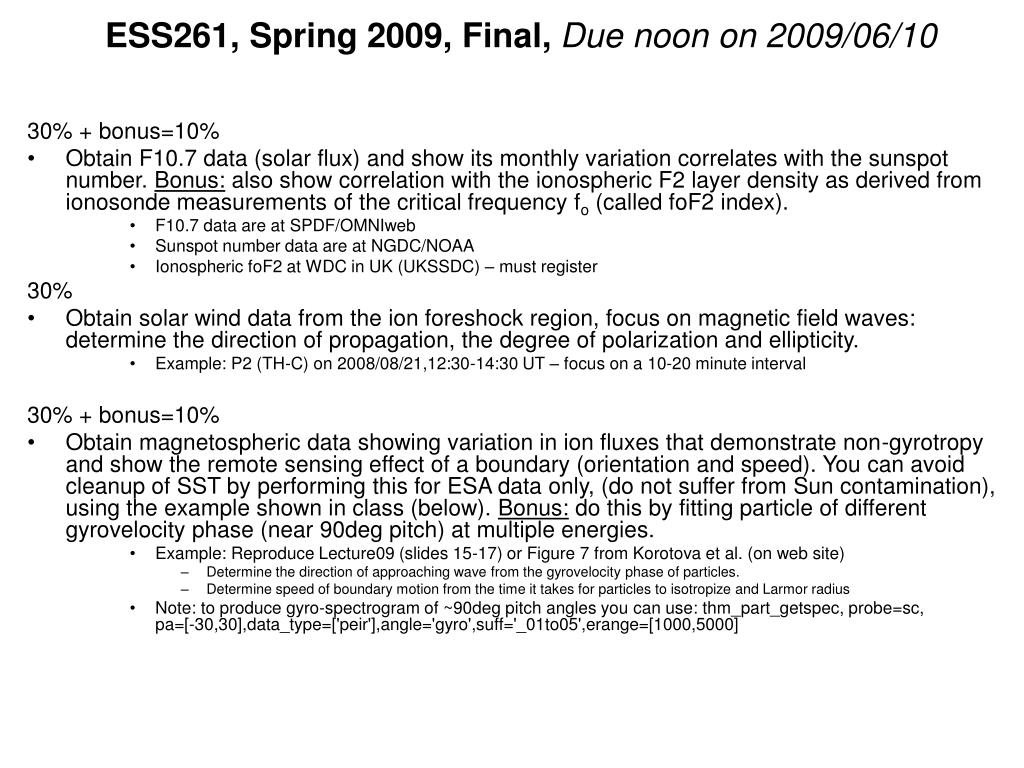
  1. ESS261, Spring 2009, Final, Due noon on 2009/06/10 30% + bonus=10% • Obtain F10.7 data (solar flux) and show its monthly variation correlates with the sunspot number. Bonus: also show correlation with the ionospheric F2 layer density as derived from ionosonde measurements of the critical frequency fo (called foF2 index). • F10.7 data are at SPDF/OMNIweb • Sunspot number data are at NGDC/NOAA • Ionospheric foF2 at WDC in UK (UKSSDC) – must register 30% • Obtain solar wind data from the ion foreshock region, focus on magnetic field waves: determine the direction of propagation, the degree of polarization and ellipticity. • Example: P2 (TH-C) on 2008/08/21,12:30-14:30 UT – focus on a 10-20 minute interval 30% + bonus=10% • Obtain magnetospheric data showing variation in ion fluxes that demonstrate non-gyrotropy and show the remote sensing effect of a boundary (orientation and speed). You can avoid cleanup of SST by performing this for ESA data only, (do not suffer from Sun contamination), using the example shown in class (below). Bonus: do this by fitting particle of different gyrovelocity phase (near 90deg pitch) at multiple energies. • Example: Reproduce Lecture09 (slides 15-17) or Figure 7 from Korotova et al. (on web site) • Determine the direction of approaching wave from the gyrovelocity phase of particles. • Determine speed of boundary motion from the time it takes for particles to isotropize and Larmor radius • Note: to produce gyro-spectrogram of ~90deg pitch angles you can use: thm_part_getspec, probe=sc,pa=[-30,30],data_type=['peir'],angle='gyro',suff='_01to05',erange=[1000,5000]