Download

1 / 31
310 likes | 452 Vues
Multinational Comparisons of Health Systems Data, 2013. David Squires The Commonwealth Fund November 2013. Health Care Spending and Coverage. THE COMMONWEALTH FUND. Average Health Care Spending per Capita , 1980–2011 Adjusted for Differences in Cost of Living. Dollars ($US). THE

E N D
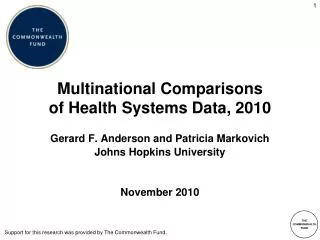
Multinational Comparisonsof Health Systems Data, 2013 David Squires The Commonwealth Fund November 2013
Health Care Spending and Coverage THE COMMONWEALTH FUND
Average Health Care Spending per Capita, 1980–2011Adjusted for Differences in Cost of Living Dollars ($US) THE COMMONWEALTH FUND * 2010 Source: OECD Health Data 2013.
Health Care Spending as a Percentage of GDP, 1980–2011 Percent THE COMMONWEALTH FUND * 2010 GDP refers to gross domestic product. Source: OECD Health Data 2013.
Health Care Spending per Capita by Source of Funding, 2011Adjusted for Differences in Cost of Living Dollars ($US) 8,508 5,643 4,522 4,495 4,495 4,118 3,925 3,800 3,405 3,213 3,182 THE COMMONWEALTH FUND * 2010. Source: OECD Health Data 2013.
Pharmaceutical Spending per Capita, 2011Adjusted for Differences in Cost of Living Dollars ($US) THE COMMONWEALTH FUND * 2010. Source: OECD Health Data 2013.
Health Care Supply and Utilization THE COMMONWEALTH FUND
Hospital Discharges per 1,000 Population, 2011 THE COMMONWEALTH FUND * 2010. Source: OECD Health Data 2013.
Average Length of Hospital Stay for Acute Care, 2011 Days THE COMMONWEALTH FUND * 2010. Source: OECD Health Data 2013.
Average Annual Number of Physician Visits per Capita, 2011 THE COMMONWEALTH FUND * 2010. ** 2009. Source: OECD Health Data 2013.
Number of Practicing Physicians per 1,000 Population, 2011 THE COMMONWEALTH FUND * 2010. ** 2009. Source: OECD Health Data 2013.
Number of Acute Care Hospital Beds per 1,000 Population, 2011 THE COMMONWEALTH FUND * 2010. Source: OECD Health Data 2013.
Inpatient Coronary Bypass Grafts per 100,000 Population, 2011 THE COMMONWEALTH FUND * 2010. ** 2009. Source: OECD Health Data 2013.
Magnetic Resonance Imaging (MRI) Exams per Million Population, 2011 THE COMMONWEALTH FUND * 2010. ** 2009. Source: OECD Health Data 2013.
Health Promotion and Disease Prevention THE COMMONWEALTH FUND
Cervical Cancer Screening Rates, 2011 Percent of women screened Note: NOR, NZ, UK, DEN, and AUS based on program data; all other countries based on survey data. THE COMMONWEALTH FUND * 2010. ** 2009. Source: OECD Health Data 2013.
Flu Immunization Among Adults Age 65 or Older, 2011 Percent THE COMMONWEALTH FUND * 2010. ** 2009. Source: OECD Health Data 2013.
Adults Who Report Being Daily Smokers, 2011 Percent THE COMMONWEALTH FUND * 2010. ** 2009. Source: OECD Health Data 2013.
Obesity (BMI>30) Prevalence Among Adult Population, 2011 Percent Self-reported Measured Note: Body-mass index (BMI) estimates based on national health interview surveys (self-reported data) are usually significantly lower than estimates based on actual measurements. THE COMMONWEALTH FUND * 2010. ** 2009. Source: OECD Health Data 2013.
Quality and Patient Safety THE COMMONWEALTH FUND
Mortality Amenable to Health Care Deaths per 100,000 population* * Countries’ age-standardized death rates before age 75; including ischemic heart disease, diabetes, stroke, and bacterial infections. Analysis of World Health Organization mortality files and CDC mortality data for U.S. THE COMMONWEALTH FUND Source: Adapted from E. Nolte and M. McKee, “Variations in Amenable Mortality—Trends in 16 High-Income Nations,” Health Policy, published online Sept. 12, 2011.
Breast Cancer Five-Year Relative Survival Rate, 2004–2009(or nearest period) Percent THE COMMONWEALTH FUND Source: OECD Health Data 2013.
Diabetes Lower Extremity Amputation Rates per 100,000 Population, 2009 THE COMMONWEALTH FUND * 2008. ** 2007. Source: OECD Health Data 2013.
In-Hospital Mortality After Admission for Acute Myocardial Infarction†per 100 Patients, 2009 †In-hospital case-fatality rates within 30 days of admission. Age-sex standardized rates. THE COMMONWEALTH FUND * 2008. ** 2007. Source: OECD Health Data 2013.
Foreign Object Left in Body During Procedure per 100,000 Hospital Discharges, 2009 Note: Age-sex-SDX standardized rates. THE COMMONWEALTH FUND * 2008. ** 2010. Source: OECD Health Data 2013.
Prices THE COMMONWEALTH FUND
Retail Price Indexes for Basket of In-Patent Pharmaceuticals, 2010US is set at 100 Price level Note: Calculations weighted relative to U.S. consumption patterns. U.S. retail prices were discounted from manufacturer prices according to the rebates obtained by the Medicaid program. THE COMMONWEALTH FUND Source: P. Kanavos, A. Ferrario, S. Vandoros et al., "Higher U.S. Branded Drug Prices and Spending Compared to Other Countries May Stem Partly from Quick Uptake of New Drugs," Health Affairs, April 2013 32(4):753–61.
Diagnostic Imaging Prices, 2012 MRI scanning and imaging fees CT scanning and imaging fees (head) THE COMMONWEALTH FUND Notes: US refers to the commercial average. MRI refers to magnetic resonance imaging; CT refers to computed tomography. Source: International Federation of Health Plans, 2012 Comparative Price Report.
Hospital Spending per Discharge, 2011Adjusted for Differences in Cost of Living Dollars ($US) THE COMMONWEALTH FUND * 2010. Source: OECD Health Data 2013.
Physician Fee for Hip Replacement, 2008Adjusted for Differences in Cost of Living Private payers Public payers Dollars ($US) Dollars ($US) THE COMMONWEALTH FUND Source: M. J. Laugesenand S. A. Glied, “Higher Fees Paid to U.S. Physicians Drive Higher Spending for Physician Services Compared to Other Countries,” Health Affairs,Sept. 2011 30(9):1647–56.
Physician Incomes, 2008Adjusted for Differences in Cost of Living Dollars ($US) Orthopedic surgeons Primary care doctors THE COMMONWEALTH FUND Source: M. J. Laugesenand S. A. Glied, “Higher Fees Paid to U.S. Physicians Drive Higher Spending for Physician Services Compared to Other Countries,” Health Affairs,Sept. 2011 30(9):1647–56.