Download
1 / 69
690 likes | 717 Vues
This research study compares health system data from multiple countries in 2008, including total health care spending, spending per capita, spending on different types of services, and more.

E N D
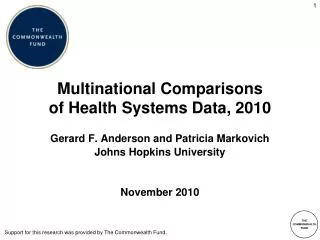
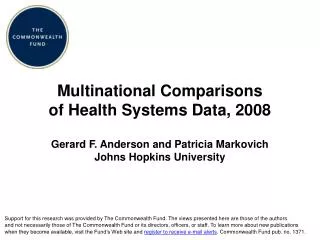
Multinational Comparisonsof Health Systems Data, 2008 Gerard F. Anderson and Patricia Markovich Johns Hopkins University Support for this research was provided by The Commonwealth Fund. The views presented here are those of the authors and not necessarily those of The Commonwealth Fund or its directors, officers, or staff. To learn more about new publications when they become available, visit the Fund’s Web site and register to receive e-mail alerts. Commonwealth Fund pub. no. 1371.
Health Care Spending per Capita, 2006Adjusted for Differences in Cost of Living *2005 Source: OECD Health Data 2008, “June 2008.”
Average spending on healthper capita ($US PPP) Total expenditures on healthas percent of GDP International Comparison of Spending on Health, 1980–2006 * From Australian Department of Health and Ageing Source: OECD Health Data 2008, “June 2008”
Average Annual Growth Rate of Real Health Care Spending per Capita, 1996–2006 *1995-2005 Source: OECD Health Data 2008, “June 2008.”
Percentage of Gross Domestic Product Spent on Health Care, 1996 and 2006 Source: OECD Health Data 2008, “June 2008.”
Percentage of Total Population with Health Insurance Coverage Through Public Programs, 2006 *2005 Source: OECD Health Data 2008, “June 2008.”
Public Spending on Health Care per Capita, 2006Adjusted for Differences in Cost of Living *2005 Source: OECD Health Data 2008, “June 2008.”
Private Spending on Health Care per Capita, 2006Excluding Out-of-Pocket Spending, Adjusted for Differences in the Cost of Living *2005 Source: OECD Health Data 2008, “June 2008.”
Out-of-Pocket Health Care Spending per Capita, 2006 Adjusted for Differences in the Cost of Living *2005 Source: OECD Health Data 2008, “June 2008.”
Health Care Expenditure per Capitaby Source of Funding, 2006Adjusted for Differences in Cost of Living $6,714 $4,311 $3,678 $3,449 $3,371 $2,999 $2,760 $2,448 *2005 Source: OECD Health Data 2008, “June 2008.”
Distribution of Health Spending by Type of Service *2005 Source: OECD Health Data 2008, “June 2008.”
Percentage of Total Health Care Spendingon Hospital Care, 1996 and 2006 *1998 and 2006 **1995 and 2005 Source: OECD Health Data 2008, “June 2008.”
Adjusted for Differences in Cost of Living Inpatient Hospital Spending per Capita, 2006 *2005 Source: OECD Health Data 2008, “June 2008.”
Hospital Spending per Discharge, 2006Adjusted for Differences in Cost of Living * 2005 **2004 Source: OECD Health Data 2008, “June 2008.”
Hospital Discharges per 1,000 Population, 2006 *2005 **2004 Source: OECD Health Data 2008, “June 2008.”
Average Length of Stay for Acute Care, 2006 *2005 Source: OECD Health Data 2008, “June 2008.”
Average Length of Hospital Stayfor Acute Myocardial Infarction, 2006 a * 2005 **2004 Source: OECD Health Data 2008, “June 2008.”
Average Length of Stay for Normal Delivery, 2006 * 2005 **2004 Source: OECD Health Data 2008, “June 2008.”
Average Annual Hospital Inpatient Acute Care Days per Capita, 2006 *2005 Source: OECD Health Data 2008, “June 2008.”
Number of Acute Care Hospital Beds per 1,000 Population, 2006 *2005 Source: OECD Health Data 2008, “June 2008.”
Average Number of Hospital Staff per Acute Care Hospital Bed, 2006 *2005 Source: OECD Health Data 2008, “June 2008.”
Percentage of Total Health Care Spending on Long-Term Nursing Care, 1996–2006 *1996–2005 Source: OECD Health Data 2008, “June 2008.”
Adjusted for Differences in Cost of Living Long-Term Institutional Care Spending per Capita, 2006 $738 $459 $417 $254 $257 *2005 Source: OECD Health Data 2008, “June 2008.”
Adjusted for Differences in Cost of Living Home Health Care Spending per Capita, 2006 *2005 Source: OECD Health Data 2008, “June 2008.”
Number of Long-Term Care Beds in Nursing Homes per 1,000 Population Age 65 and Older, 1996–2006 *1996–2005 Source: OECD Health Data 2008, “June 2008.”
Percentage of Total Health Care Spendingon Basic Medical and Diagnostic Services, 2006 *2005 Source: OECD Health Data 2008, “June 2008.”
Percentage of Total Health Care Spending on Basic Medical and Diagnostic Services, 1996 and 2006 *1996–2005 Source: OECD Health Data 2008, “June 2008.”
Spending on Basic Medical and Diagnostic Services,per Capita in 2006Adjusted for Differences in Cost of Living *2005 Source: OECD Health Data 2008, “June 2008.”
Number of Practicing Physiciansper 1,000 Population, 2006 *2005 Source: OECD Health Data 2008, “June 2008.”
Average Annual Growth Rate of Practicing Physicians per 1,000 Population, 1996–2006 *1995–2005 Source: OECD Health Data 2008, “June 2008.”
Average Annual Number of Physician Visitsper Capita, 2006 *2005 **2004 Source: OECD Health Data 2008, “June 2008.”
Number of Practicing Nursesper 1,000 Population, 2006 *2005 Source: OECD Health Data 2008, “June 2008.”
Number of Practicing Nursesper Acute Care Bed, 1996 and 2006 *1996–2005 Source: OECD Health Data 2008, “June 2008.”
Percentage of Total Health Care Spendingon Pharmaceuticals, 1996 and 2006 *1996–2005 Source: OECD Health Data 2008, “June 2008.”
Pharmaceutical Spending per Capita, 2006Adjusted for Differences in Cost of Living *2005 Source: OECD Health Data 2008, “June 2008.”
Percentage of Total Population with Pharmaceutical Coverage Through Public Programs, 2006 *2005 Source: OECD Health Data 2008, “June 2008.”
Magnetic Resonance Imaging (MRI) Unitsper Million Population, 2006 *2005 Source: OECD Health Data 2008, “June 2008.”
Computer Tomography (CT) Scannersper Million Population, 2006 * 2005 ** 2004 Source: OECD Health Data 2008, “June 2008.”
Inpatient Cardiac Catheterization Proceduresper 100,000 Population, 2006 * 2005 **2004 Source: OECD Health Data 2008, “June 2008.”
Inpatient Percutaneous Transluminal Coronary Angioplasty (PTCA) Interventions per 100,000 Population, 2006 * 2005 **2004 Source: OECD Health Data 2008, “June 2008.”
Number of Inpatient Knee Replacementsper 100,000 Population, 2006 * 2005 **2004 Source: OECD Health Data 2008, “June 2008.”
Percentage of Total Surgery Procedures That Are Day Cases, 2006 a * 2005 Source: OECD Health Data 2008, “June 2008.”
Number of Patients Undergoing Dialysis Treatment per 100,000 Population, 2006 * 2005 Source: OECD Health Data 2008, “June 2008.”