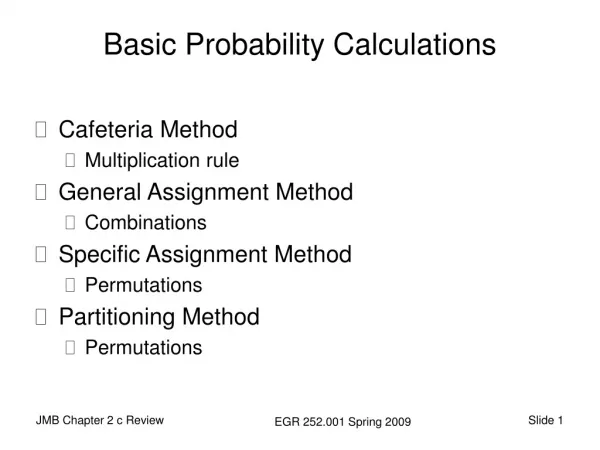
Utilizing Probability in Business Decision Making
Explore how probability is used in business, from predicting sales outcomes to evaluating risks and creating scenario analyses. Learn about key terms like event, sample space, and visualizing events.

Utilizing Probability in Business Decision Making
E N D
Presentation Transcript
What are the chances that sales will decrease if we increase prices? What is the likelihood a new assembly method method will increase productivity? What are the odds that a new investment will be profitable? Uncertainties Managers often base their decisions on an analysis of uncertainties such as the following:
Probability in Manufacturing Manufacturing businesses can use probability to determine the cost-benefit ratio or the transfer of a new manufacturing technology process by addressing the likelihood of improved profits. In other instances, manufacturing firms use probability to determine the possibility of financial success of a new product when considering competition from other manufacturers, market demand, market value and manufacturing costs. Other instances of probability in manufacturing include determining the likelihood of producing defective products, and regional need and capacity for certain fields of manufacturing. Application in Business
Scenario Analysis Probability distributions can be used to create scenario analyses. For example, a business might create three scenarios: worst-case, likely and best-case. The worst-case scenario would contain some value from the lower end of the probability distribution; the likely scenario would contain a value towards the middle of the distribution; and the best-case scenario would contain a value in the upper end of the scenario. Risk Evaluation In addition to predicting future sales levels, probability distribution can be a useful tool for evaluating risk. Consider, for example, a company considering entering a new business line. If the company needs to generate $500,000 in revenue in order to break even and their probability distribution tells them that there is a 10 percent chance that revenues will be less than $500,000, the company knows roughly what level of risk it is facing if it decides to pursue that new business line. Application in Business
Sales Forecasting One practical use for probability distributions and scenario analysis in business is to predict future levels of sales. It is essentially impossible to predict the precise value of a future sales level; however, businesses still need to be able to plan for future events. Using a scenario analysis based on a probability distribution can help a company frame its possible future values in terms of a likely sales level and a worst-case and best-case scenario. By doing so, the company can base its business plans on the likely scenario but still be aware of the alternative possibilities. Application in Business
Important Terms • Probability – the chance that an uncertain event will occur (always between 0 and 1) • Event – Each possible outcome of a variable • Simple Event – an event that can be described by a single characteristic • e.g. Tossing a coin: Getting head is one event Getting tail is another event Here, “Tossing a coin” is referred as ‘EXPERIMENT’ If we collect all the outcomes or events of an experiment that is called sample space. • Sample Space – the collection of all possible events e.g. Sample space can be written as : S = {Head tail}
Sample Space The Sample Space is the collection of all possible events e.g. All 6 faces of a die: e.g. All 52 cards of a bridge deck:
Events • Simple event • An outcome from a sample space with one characteristic • e.g., A red card from a deck of cards • Complement of an event A (denoted A’) • All outcomes that are not part of event A • e.g., All cards that are not diamonds • Joint event • Involves two or more characteristics simultaneously • e.g., An ace that is also red from a deck of cards • Favorable event • Events in which we are interested • e.g. Interest is have even number when rolling a die • Equally likely events • Non preference of occurring of any event • e.g. tossing a coin, event can be head or tail
Visualizing Events • Contingency Tables Purchasing a big screen TV Actually purchased Planned to purchase Yes No Total Yes 200 50 250 No 100 650 750 Total 300 700 1000 Sample Space
An Experiment and Its Sample Space • Example: Bradley Investments Bradley has invested in two stocks, Markley Oil and Collins Mining. Bradley has determined that the possible outcomes of these investments three months from now are as follows. Investment Gain or Loss in 3 Months (in $000) Collins Mining Markley Oil 8 -2 10 5 0 -20
Subjective Method • Example: Bradley Investments An analyst made the following probability estimates. Exper. Outcome Net Gain or Loss Probability (10, 8) (10, -2) (5, 8) (5, -2) (0, 8) (0, -2) (-20, 8) (-20, -2) $18,000 Gain $8,000 Gain $13,000 Gain $3,000 Gain $8,000 Gain $2,000 Loss $12,000 Loss $22,000 Loss .20 .08 .16 .26 .10 .12 .02 .06
Probability as a Numerical Measureof the Likelihood of Occurrence Increasing Likelihood of Occurrence 0 .5 1 Probability: The event is very unlikely to occur. The occurrence of the event is just as likely as it is unlikely. The event is almost certain to occur.
Visualizing Events • Venn Diagrams • Let A = Planned to purchase • Let B = Actually purchased A A ∩ B = Planned and actually purchased Planned A Actually Purchased B B A U B = Planned or actually purchased
Fundamental Concepts • The probability, P, of any event or state of nature occurring is greater than or equal to 0 and less than or equal to 1. That is: 0 P (event) 1 • The sum of the simple probabilities for all possible outcomes of an activity must equal 1
Diversey Paint Example • Demand for white latex paint at Diversey Paint and Supply has always been either 0, 1, 2, 3, or 4 gallons per day • Over the past 200 days, the owner has observed the following frequencies of demand
Diversey Paint Example • Demand for white latex paint at Diversey Paint and Supply has always been either 0, 1, 2, 3, or 4 gallons per day • Over the past 200 days, the owner has observed the following frequencies of demand Notice the individual probabilities are all between 0 and 1 0 ≤ P (event) ≤ 1 And the total of all event probabilities equals 1 ∑ P (event) = 1.00
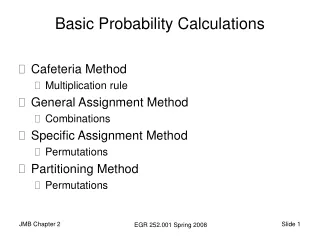
1 2 Number of occurrences of the event Total number of trials or outcomes Number of ways of getting a head Number of possible outcomes (head or tail) P (event) = P (head) = Types of Probability Determiningobjective probability • Relative frequency • Typically based on historical data • Classical or logical method • Logically determine probabilities without trials
Types of Probability Subjective probability is based on the experience and judgment of the person making the estimate • Opinion polls • Judgment of experts • Delphi method • Other methods
Example Find the probability of selecting a male taking statistics from the population described in the following table:
Mutually Exclusive Events Events are said to be mutually exclusive if only one of the events can occur on any one trial • Mutually exclusiveevents • Events that cannot occur together example: • Tossing a coin will result in eithera head or a tail • Events A and B are mutually exclusive A = defective; B = non-defective
Collectively Exhaustive Events • Events are said to be collectively exhaustiveif the list of outcomes includes every possible outcome • One of the events must occur • The set of events covers the entire sample space example: Sample : 400 units are there in one lot Experiment : drawing an unit from the lot Simple event: A = Defective; B = Non defective Collectively exhaustive events : 350 are non defective and 50 are defective units.
Computing Joint and Marginal Probabilities Joint Probability P (Planned and purchased) = P (Planned and did not purchase) = P (not Planned and purchased) = Similarly others… Marginal Probability P (Planned to purchase) = Actually purchased Planned to purchase
Computing Joint and Marginal Probabilities • The probability of a joint event, A and B: • Computing a marginal (or simple) probability: • Where B1, B2, …, Bk are k mutually exclusive and collectively exhaustive events
An Experiment and Its Sample Space • Example: Bradley Investments Bradley has invested in two stocks, Markley Oil and Collins Mining. Bradley has determined that the possible outcomes of these investments three months from now are as follows. Investment Gain or Loss in 3 Months (in $000) Collins Mining Markley Oil 8 -2 10 5 0 -20
Subjective Method • Example: Bradley Investments An analyst made the following probability estimates. Exper. Outcome Net Gain or Loss Probability (10, 8) (10, -2) (5, 8) (5, -2) (0, 8) (0, -2) (-20, 8) (-20, -2) $18,000 Gain $8,000 Gain $13,000 Gain $3,000 Gain $8,000 Gain $2,000 Loss $12,000 Loss $22,000 Loss .20 .08 .16 .26 .10 .12 .02 .06
Union of Two Events The union of events A and B is the event containing all sample points that are in A or B or both. The union of events A and B is denoted by AB Sample Space S Event A Event B
Union of Two Events • Example: Bradley Investments Event M = Markley Oil Profitable Event C = Collins Mining Profitable MC = Markley Oil Profitable or Collins Mining Profitable (or both) MC = {(10, 8), (10, -2), (5, 8), (5, -2), (0, 8), (-20, 8)} P(MC) =P(10, 8) + P(10, -2) + P(5, 8) + P(5, -2) + P(0, 8) + P(-20, 8) = .20 + .08 + .16 + .26 + .10 + .02 = .82
Intersection of Two Events The intersection of events A and B is the set of all sample points that are in both A and B. The intersection of events A and B is denoted by A Sample Space S Event A Event B Intersection of A and B
Intersection of Two Events • Example: Bradley Investments Event M = Markley Oil Profitable Event C = Collins Mining Profitable MC = Markley Oil Profitable and Collins Mining Profitable MC = {(10, 8), (5, 8)} P(MC) =P(10, 8) + P(5, 8) = .20 + .16 = .36
Addition Law The addition law provides a way to compute the probability of event A, or B, or both A and B occurring. The law is written as: P(AB) = P(A) + P(B) -P(AB
Addition Law • Example: Bradley Investments Event M = Markley Oil Profitable Event C = Collins Mining Profitable MC = Markley Oil Profitable or Collins Mining Profitable We know: P(M) = .70, P(C) = .48, P(MC) = .36 Thus: P(MC) = P(M) + P(C) -P(MC) = .70 + .48 - .36 = .82 (This result is the same as that obtained earlier using the definition of the probability of an event.)
Mutually Exclusive Events Two events are said to be mutually exclusive if the events have no sample points in common. Two events are mutually exclusive if, when one event occurs, the other cannot occur. Sample Space S Event A Event B
Mutually Exclusive Events If events A and B are mutually exclusive, P(AB = 0. The addition law for mutually exclusive events is: P(AB) = P(A) + P(B) There is no need to include “-P(AB”
Adding Not Mutually Exclusive Events • The equation must be modified to account for double counting • The probability is reduced by subtracting the chance of both events occurring together P (event A or event B) = P (event A) + P (event B) –P (event Aand event B bothoccurring) P (A or B) = P (A) + P (B) –P (A and B) P(five or diamond) =P(five) + P(diamond) – P(five and diamond) = 4/52 + 13/52 – 1/52 = 16/52 = 4/13
Adding Mutually Exclusive Events • We often want to know whether one or a second event will occur • When two events are mutually exclusive, the law of addition is – P (event A or event B) = P (event A) + P (event B) P (spade or club) = P (spade) + P (club) = 13/52 + 13/52 = 26/52 = 1/2 = 0.50 = 50%
P (A and B) P (A) P (B) P (A) P (B) Events that are mutually exclusive Events that are not mutually exclusive P (A or B) = P (A) + P (B) P (A or B) = P (A) + P (B)–P (A and B) Venn Diagrams
Example P(Red or Ace) = P(Red) +P(Ace) - P(Redand Ace) = 26/52 + 4/52 - 2/52 = 28/52 Don’t count the two red aces twice! Color Type Total Red Black 2 2 4 Ace 24 24 48 Non-Ace 26 26 52 Total
Computing Conditional Probabilities • A conditional probability is the probability of one event, given that another event has occurred: The conditional probability of A given that B has occurred The conditional probability of B given that A has occurred Where P(A and B) = joint probability of A and B P(A) = marginal probability of A P(B) = marginal probability of B
= Collins Mining Profitable given Markley Oil Profitable Conditional Probability • Example: Bradley Investments Event M = Markley Oil Profitable Event C = Collins Mining Profitable We know: P(MC) = .36, P(M) = .70 Thus:
Conditional Probability Example • What is the probability that a car has a CD player, given that it has AC ? i.e., we want to find P(CD | AC) • Of the cars on a used car lot, 70% have air conditioning (AC) and 40% have a CD player (CD). 20% of the cars have both.
Conditional Probability Example (continued) • Of the cars on a used car lot, 70% have air conditioning (AC) and 40% have a CD player (CD). 20% of the cars have both. CD No CD Total 0.2 0.5 0.7 AC 0.2 0.1 No AC 0.3 0.4 0.6 1.0 Total
Conditional Probability Example (continued) • Given AC, we only consider the top row (70% of the cars). Of these, 20% have a CD player. 20% of 70% is about 28.57%. CD No CD Total 0.2 0.5 0.7 AC 0.2 0.1 No AC 0.3 0.4 0.6 1.0 Total
Multiplication Law The multiplication law provides a way to compute the probability of the intersection of two events. The law is written as: P(AB) = P(B)P(A|B)
Multiplication Law • Example: Bradley Investments Event M = Markley Oil Profitable Event C = Collins Mining Profitable MC = Markley Oil Profitable and Collins Mining Profitable We know: P(M) = .70, P(C|M) = .5143 Thus: P(MC) = P(M)P(C|M) = (.70)(.5143) = .36 (This result is the same as that obtained earlier using the definition of the probability of an event.)
Independent Events If the probability of event A is not changed by the existence of event B, we would say that events A and B are independent. Two events A and B are independent if: P(A|B) = P(A) P(B|A) = P(B) or
Multiplication Law for Independent Events The multiplication law also can be used as a test to see if two events are independent. The law is written as: P(AB) = P(A)P(B)
Multiplication Lawfor Independent Events • Example: Bradley Investments Event M = Markley Oil Profitable Event C = Collins Mining Profitable Are events M and C independent? DoesP(MC) = P(M)P(C) ? We know: P(MC) = .36, P(M) = .70, P(C) = .48 But: P(M)P(C) = (.70)(.48) = .34, not .36 Hence: M and C are not independent.
A black ball drawn on first draw P (B) = 0.30 (a marginal probability) Two green balls drawn P (GG) = P (G) x P (G) = 0.7 x 0.7 = 0.49(a joint probability for two independent events) Independent Events • A bucket contains 3 black balls and 7 green balls • We draw a ball from the bucket, replace it, and draw a second ball
A black ball drawn on second draw if the first draw is green P (B | G) = P (B) = 0.30 (a conditional probability but equal to the marginal because the two draws are independent events) A green ball is drawn on the second if the first draw was green P (G | G) = P (G) = 0.70(a conditional probability as in event 3) Independent Events • A bucket contains 3 black balls and 7 green balls • We draw a ball from the bucket, replace it, and draw a second ball
When Events Are Dependent • Assume that we have an urn containing 10 balls of the following descriptions • 4 are white (W) and lettered (L) • 2 are white (W) and numbered (N) • 3 are yellow (Y) and lettered (L) • 1 is yellow (Y) and numbered (N) P (WL) = 4/10 = 0.4 P (YL) = 3/10 = 0.3 P(WN) = 2/10 = 0.2 P (YN) = 1/10 = 0.1 P (W) = 6/10 = 0.6 P (L) = 7/10 = 0.7 P (Y) = 4/10 = 0.4 P (N) = 3/10 = 0.3