Process Re-engineering
Process Re-engineering. Process Mapping. Onshore Risk Assessment & Controls Identification. Metrics Design. Overall Monthly Control Certification/Governance. Detailed mapping of the MI process and bucketing in following categories: Data capture Data manipulation Reporting

Process Re-engineering
E N D
Presentation Transcript
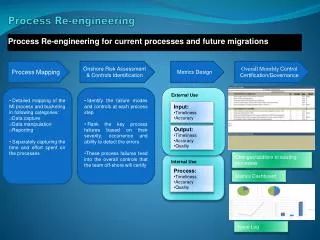
Process Re-engineering Process Mapping Onshore Risk Assessment & Controls Identification Metrics Design Overall Monthly Control Certification/Governance • Detailed mapping of the MI process and bucketing in following categories: • Data capture • Data manipulation • Reporting • Separately capturing the time and effort spent on the processes • Identify the failure modes and controls at each process step • Rank the key process failures based on their severity, occurrence and ability to detect the errors • These process failures feed into the overall controls that the team off-shore will certify External Use • Input: • Timeliness • Accuracy Process Re-engineering for current processes and future migrations • Output: • Timeliness • Accuracy • Quality Changes/addition to existing processes Internal Use • Process: • Timeliness • Accuracy • Quality Metrics Dashboard Issue Log
Process Mapping Link Update from XYZ System Calculate the segmental split for NII Calculate Bad Debt segmental data Prepare Final Report and review Submit to Team XYZ Process Reporting Receive the files for NII,OOI and average balance from CMB Business Analysis Team Receive the files for NII,OOI and average balance from CMB Business Analysis Team Populate final output in group reporting format Submit to On-shore team Start Rollover the Schedule End Populate final output in group reporting format Query on Input Query on Input Update System Links for data Populate final output in group reporting format Calculate the Segmental NII,OOI and Average Balance using segmental percentages Calculate the Segmental NII,OOI and Average Balance using segmental percentages
Failure Mode and Effects Analysis (‘FMEA’) uses risk-controls based approach to capture the process Why do the errors breakdown in the process occur Failure Mode- What can go wrong in the process What are the current controls in the process- this is extended further to include the revised controls required in the process What is the impact of the failure on the process Process Step- linked to the detailed process maps How serious is the impact of the error/process breakdown-ranked from 1-10 with 10 being most serious How often is the occurrence of the error/process breakdown-ranked from 1-10 with 10 being most frequent How easily can the occurrence of the error/process breakdown be detected –ranked from 1-10 with 1 being most easily detected Risk Priority number-product of the severity, occurrence and detection – the highest RPN number process steps are most critical
PE framework Output-Monthly Overall Certification by Process Owner
Germany- Value Stream Analysis To Be Production-Primary & Supplementary