Download
1 / 48
480 likes | 627 Vues
This document outlines the imperative to re-engineer the production processes within organizations, emphasizing the need for greater flexibility and responsiveness to evolving customer demands. It details the benefits of re-engineering, including cost savings and faster market delivery for new services and products. The text covers six key work streams vital for the transition, such as IT infrastructure enhancements, effective service creation and delivery, and the integration of scalable data acquisition systems. Key principles guide the re-engineering program, prioritizing long-term improvements and accountability.

E N D
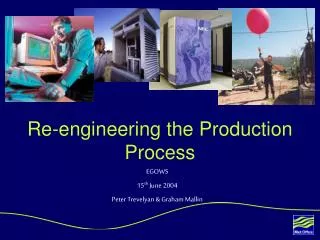
Re-engineering the Production Process EGOWS 15th June 2004 Peter Trevelyan & Graham Mallin
Why Re-engineer? • Greater flexibility & scalability in meeting new and changing customer requirements. • Provide the platform for new products & services for the future. • Reduce the costs involved in the supply of products and services to customers.
Benefits being delivered • Flexibility • Responsive to data requirements • IT more responsive to demand • Developments quicker to market • New services quicker to market • Cost savings • Reduced costs of obs supply • More cost efficient development • Reduced costs of IT infrastructure • Reduced costs of telecomms • Reduced costs of Forecast Production • Reduced cost of service creation • Maintaining Improvements • Maintain capability and reduced cost base • Metrics to allow better business decisions • Service delivery management
Six main work streams • IT Infrastructure – Delivering a scalable, flexible IT infrastructure which meets the needs of the future Met Office. • Adding Knowledge and Value – To take data and information and add knowledge and value to it to allow service creation and delivery. • Obtaining data & Information – A scalable and cost effective observing network that supports more than just ‘meteorological’ observations.
Six main work streams • Service Creation & Delivery – Ensuring that our Re-engineering project delivers what the Met Office needs …… and is ready for what Re-engineering will deliver. • People – To effectively manage the people transition • Process - To enable and facilitate Re-engineering to deliver an updated set of business processes.
Re-engineering Operating Principles • The Core Re-engineering team will act as ‘Design Authority’ • Determining new environment and processes • Co-ordinate & provide guidance to projects / programmes • Each Development project will have a ‘Re-engineering review’ milestone before commencing. • Managing the overall Re-engineering Programme
Re-engineering Operating Principles • Programme Priority – V High. • Programme starts in earnest April 04. • 2 year implementation. • Sets the foundation for ongoing improvement. • Regular deliverables. • Stick to the target architecture - challenge all exceptions. • External expertise where it can add value will be used.
Some of the challenges • Implementing lasting change. • Priority of Re-engineering v other key objectives. • Learning curve for the organisation. • Involving customers. • Managing the programme and not the detail. • It’s not a panacea!
Adding Knowledge and Value • A consistent set of high quality products efficiently produced to enable the cost effective creation of services for customers.
Adding Knowledge and ValueDeliverables • Centralisation of product creation • Increased automation of product creation • Meteorologically consistent products • Increased flexibility in the creation of services from products. • Changed forecaster roles to include consultant meteorologist
Obtaining Data and Information • A scalable and cost effective observing network that supports more that just ‘meteorological’ observations
Obtaining Data and Information Deliverables • More scalable and flexible observing systems • Standard data processing methodologies • Targeted Observing and Virtual Observations introduced • Reduced manual involvement in observation creation, collection and processing • Centralised observing network support function
Service Creation & Delivery • Ensuring that our Re-engineering project delivers what the Met Office needs … and is ready for what Re-engineering will deliver.
Service Creation & DeliveryDeliverables • Detailed business requirements in order to guide Re-engineering Roadmap • Ensuring that we deliver what the business needs • Migration of customers to new architecture. • Introduction of Service Delivery management
IT Infrastructure • Delivering a scalable, flexible IT infrastructure which meets the needs of the future Met Office
IT InfrastructureDeliverables • More Distributed and scaleable IT Architecture with common standards and support tools – leading to systems and support that are more responsive to changes in demand • Unified Development Process – using up to date efficient tools with highly skilled development staff – quicker and cheaper to deliver software. • Clearer “cost of development” model, with Unified Development model. • Removal of redundant architecture and legacy systems – reduce IT costs • Improved IT Governance • Ability to collect metrics
IT InfrastructureBenefits • IT systems and support more responsive to changes in demand • Developments quicker to market • More cost efficient development • Reduced running cost of IT infrastructure • Reduced running cost of telecoms • Improved IT Infrastructure governance • Improved production process metrics
IT Infrastructure – Issues • New technologies • Development Process • Demonstrate capability early • MoD, security etc • Some customers have long timescales • Logical Data Store (LDS) will take time! • E-commerce strategy
IT Infrastructure Timeline Apr04 Apr05 Apr06 Dec06 Enterprise architecture Complete development process roll-out Applications migrated Governance adopted Web portal established Telecoms infrastructure LDS fully operational LDS design GPCS migration complete
Strategic IT themes • Flexible, resilient, highly available, secure • Distributed, component-based framework • Java J2EE (where fit for purpose) • Service Oriented Architecture • Middleware … the “glue” • Exploit existing “legacy” systems • We’re not starting from scratch! • Consolidation of the “multitude” of platforms • Linux
Architecture Roadmap IT Strategy Principles Requirements Context Management Process Overview Business Requirements Component Model Data Model Operational Model Conceptual Level IT Requirements Specification Level Physical Level Implementation Plan
Revised Business Processes • To enable and facilitate Re-engineering to deliver an updated set of business processes which: • reflect the changes resulting from the Programme and • meet the evolving future needs of the Met Office.
Revised Business Processes Deliverables To enable and facilitate Re-engineering to deliver • new production process map • new overall Met Office process map • new organisational structure • continued ISO9001 certification • demonstrated process improvements using new performance measures.
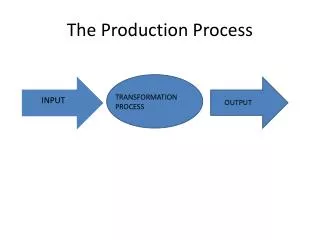
Creating the 4D Data Cube • The source of “Environmental Intelligence” • Need to transform the output from the forecaster into a form that can be used by cooperating processes. • The majority of the content needs to be digital as it is not easy to make quantitative use of a picture.
Creating the 4D Data Cube • The forecaster needs tools that enable them to “digitally” edit the atmosphere and in particular gridded data (“On Screen Field Modification”). • The edit needs to be in time and space. • The process must be intuitive to the forecaster. • The edit process needs to be scientifically sound i.e. the “balance of the atmosphere needs to be maintained. • The forecaster need only edit one field and all others be changed.
Forecasting Process The transform of the Meteorologist’s View of the world into one that forms a key component required by the “Product Tailoring Process” and also a key element of the “Common Operating Picture”required by all Key Decision makers. 01/0364 29
Gridded data set from NWP Grid modification Modified gridded data set Adding value to model data Field modification
OSFM • A tool that allows the forecaster to edit, in four dimensions NWP data. • The resultant amended data is saved in the database and therefore available to all other “down stream” process. • The forecaster edits fields on the basis of supporting data. • The resulting digital database will form the basis of most down stream product creation. • The scales can vary from Global to high resolution Meso-Scale models. • The OSFM process can be proved to add value through objective verification.
The change in Equivalent Potential Temperature as a result of editing the surface pressure.
The change in Equivalent Potential Temperature as a result of editing the surface pressure.
Mesoscale OSFM • Developed in 2002 to augment OSFM • Expanded parameter list includes fog probability and cloud prediction • Model merge facility from successive runs or different models • Ability to apply operators (multiply, add etc) to selected cloud and precipitation fields
Need to evaluate the OSFM process to ensure it delivers value.
Proving the value of FITL • Met Office routinely proving the value of human forecaster with verification stats • Quantifying the value of modifying certain model fields (cloud, precip, fog etc) • Recognize models are increasingly reliable • In JET need methodology for how forecaster will operate in future
OSFM Benefits • Enables forecasters to provide best guidance • More emphasis on understanding models • Generates graphical guidance information • Excellent “what if” analysis tool • Allows the forecaster more time for ‘meteorology’ • Modified gridded data for use in automated product generation
Adding value to model data Derived Data • Calculate derived data for special applications • CAT, Icing, Thunderstorm Indices etc • Either as “one-off” or routinely • Only need to send model data to user • Reduce transmissions • User creates data required • Flexibility to use different model data
The atmosphere is a chaotic system: “… one flap of a seagull’s wing may forever change the future course of the weather”, (Lorenz, 1963) Up to about 3 days ahead we can usually forecast the general pattern of the weather quite accurately Beyond 3 days Chaos becomes a major factor Medium-Range Forecasting - The Effect of Chaos • Tiny errors in how we analyse the current state of the atmosphere lead to large errors in the forecast – these are both equally valid 4-day forecasts!
Ensembles... Deterministic Forecast Forecast uncertainty Initial Condition Uncertainty X Analysis Climatology time
In an ensemble forecast we run the model many times from slightly different initial conditions These provide a range of ‘equally probable’ forecast solutions Allow forecasters to: Assess possible outcomes Estimate risks and probabilities Gauge confidence Ensembles
ECMWF Ensemble prediction System (EPS) • 51 members: • Control run from unperturbed ECMWF analysis • 25 perturbations, each added to and subtracted from the control analysis to create a pair of runs • ECMWF model at 80km resolution
Summarising information • The Ensemble contains a huge amount of information – need to summarise • Tubing (left) identifies most probable (top) and most extreme (below) forecasts • Clustering groups together similar forecasts • Cyclone Tracking (right) shows low centres
EPS Meteogram • Plot of ensemble spread • Box shows 25-75% range • Whiskers show 95% confidence range • Central bar shows median – can indicate most probable • Summarises forecast at one location for 10 days ahead • Met Office calibrates ensemble forecasts to improve quality
100% Prob 0% Stacked Probability Charts Ideal for identifying “Weather Windows”
Probability Forecasts from Ensembles • Ensembles help forecasters assess the most probable weather • Probability forecasts help end users to assess and manage risk in an uncertain world
Tropical Cyclone Probabilities • Tropical Cyclones are quite small but very damaging • Forecasting the exact position of landfall is important but difficult • Ensemble provides a range of tracks • From these we can estimate theprobability of a storm strike inthe next 3 days Hurricane Isabel, September 2003