Download
1 / 72
720 likes | 940 Vues
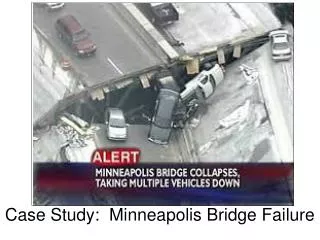
City of Minneapolis Transportation Infrastructure Study. Heidi Hamilton, City of Minneapolis Dave Hutton, SRF Consulting Group. City of Minneapolis Statistics 58.4 square miles Population – 382,600 Twin cities metro population – 3.5 M Age of infrastructure – 50+ years. Objective :

E N D
City of Minneapolis Transportation Infrastructure Study Heidi Hamilton, City of Minneapolis Dave Hutton, SRF Consulting Group
City of Minneapolis Statistics • 58.4 square miles • Population – 382,600 • Twin cities metro population – 3.5 M • Age of infrastructure – 50+ years
Objective: Provide the Mayor, City Council, and Public Works Leadership with policy choices and the background information necessary to support informed policy decisions related to the existing transportation infrastructure: • Prioritize how funding should be allocated • Determine whether to pursue new funding sources
Infrastructure Elements Included in the Analysis: • 1,338 miles of pavements • 89 Bridges • 16,118 Street Lights • 793 Traffic Signals
Other items/needs not included in study: • Traffic Signs • Green spaces • Bicycle trails • Pavement markings • New/expanded infrastructure
Background: • Currently, funding availability drives infrastructure investment decisions • Existing funding is inadequate • City needs to plan its future • Information will assist with tough decisions
Four questions needed to be answered: • What condition is the infrastructure in? • What is its future condition based on current funding levels? ……based on more funding? • How does our funding and infrastructure condition compare to other comparable cities? • How can the city get more funding?
Study Process Establish PW Steering Committee Analyze Existing conditions - interviews with key department staff - Review existing maintenance records - Review past funding/expenses levels Determine levels of Investments to analyze Determine impacts of the alternatives
Steering Committee Steve Kotke, Director of Public Works Heidi Hamilton, Deputy DPW Don Elwood, Dir – Transp Planning & Engr Jon Wertjes, Dir – Traffic and Parking Mike Kennedy, Dir – Transp Maint/Repair Susan Hartman, Dir – Mgt Services/Budget
Existing Inventory & Current Conditions Street Pavement Before After
Pavement Condition Index (PCI) • The Pavement Condition Index (PCI) is a numerical index between 0 and 100 that is used to indicate the condition of a roadway. It is a statistical measure and is based on a visual survey of the pavement. A numerical value between 0 and 100 defines the condition with 100 representing an excellent pavement. Before After
PCI Categories • Very Good 100-88 • Good 87-75 • Fair 74-60 • Poor 59-35 • Very Poor 34-1
Pavement life cycle Source: America Public Works Association, The Hole Story
Pavement Inventory • Municipal State Aid - 206 miles • Residential – 632 miles • Local – 70 miles • Alleys – 378 miles
Existing Pavement Condition Index (all roadways) 1996 PCI = 80 2010 PCI = 65 The concern is that the City is not keeping up with the degradation of pavements as evidenced by the drop in PCI.
Investment Scenarios - Pavements Baseline scenario reflected past 10 years of spending. Analyzed 6 different funding scenarios several of which had sub- variations. Used 5 year CIP to establish needs for the first 5 years. Then projected out over a 20 year horizon for needs
Investment Scenarios - Pavements Maintain current spending levels Allocate all funding only to MSA streets Achieve and maintain target level average PCI and minimum PCI in 10 years (preferred) Achieve and maintain target level average PCI with NO minimum PCI in 10 years Achieve and maintain target level average PCI and minimum PCI in 20 years Achieve and maintain target level average PCI and NO minimum PCI in 20 years
Bridges Source: KSTP Camden Bridge, left; Plymouth Avenue Bridge, above
Bridge Sufficiency Rating • A national standard defined by the Federal Highway Administration. • A measure of the bridges sufficiency to remain in service. • Overall Sufficiency Rating Score (0-100 scale) • Adequate Condition • Structurally Deficient • Functionally Obsolete
Bridge Service Life Standards: • 75 year service life • Preventive maintenance following recommended industry standards for each structure.
Financial assumptions – 3 scenarios evaluated • Current: Limited preventive maintenance occurs, otherwise all maintenance is reactive. Bridges are replaced or rehabilitated only when state or federal funding is secured. • Ideal: Service life and maintenance standards are met for all bridges. • Constrained: Bridges are rehabilitated or replaced at service life standard interval but maintenance funding is not increased from current levels.
Ideal Bridge Funding (89 city vehicular bridges) Replacement and Rehabilitation (capital program) • $3.1M/yr average needed • Averaged $2.9M/yr in 2000-2011 Maintenance funding: • Additional $450k/yr for bridge maintenance needed
Other Bridge Needs Not in study: • Midtown Greenway Bridges – 36 total • Railroad bridges • “Betterments” for State and County bridges – i.e. bike lanes, wider sidewalks, upgraded railings or lighting • Pedestrian bridges
Existing Inventory & Current Conditions Traffic Signals
793 signalized intersections. • Costs generally shared based on intersection legs.
Condition of signals • Signal poles and underground wiring: • Most exceed the 30 year service life. • Signal controllers/cabinets: • 340 of the 793 intersection exceed15 year service life, but will be replaced with federal funding. • 433 don’t exceed the 15 year service life now but are aging.
Traffic Signal Service Life Standards: • Complete System Rebuild/Replacement: 30 years ($150k-$200k each) • Cabinet/Controller Replacement: 15 years ($36k each) • Signal Timing Updates: 5 years($3k each) • Annual preventive maintenance to prolong life ($3.5k per year per intersection)
Financial assumptions – 3 scenarios • Current: Reactive maintenance with minimal system replacement, primarily in conjunction with street reconstruction projects. • Ideal: Service life standards are met for all signals. • Constrained: Service life standards are met for ~500 intersections that are most critical for traffic flow. Remaining intersections continue to receive only reactive maintenance and replacement with major capital projects.
Impact of underfunding: • Inefficiency of traffic flow • Traffic diversion to side streets and neighborhoods • Negative economic impact • Increased fuel usage • Aesthetic concerns (rusty poles).