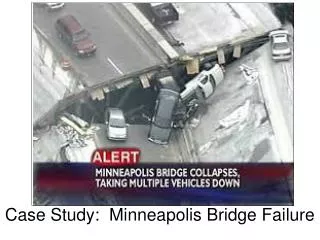
Case Study: Minneapolis Bridge Failure
Case Study: Minneapolis Bridge Failure. Biblical Reference. Suddenly, the walls of Jericho collapsed. Joshua 6:20. The Minneapolis Bridge Failure. On August 1, 2007, the center section of the Interstate-35W bridge in Minneapolis, Minnesota, suddenly collapsed .

Case Study: Minneapolis Bridge Failure
E N D
Presentation Transcript
Biblical Reference Suddenly, the walls of Jericho collapsed. Joshua 6:20
The Minneapolis Bridge Failure • On August 1, 2007, the center section of the Interstate-35W bridge in Minneapolis, Minnesota, suddenly collapsed. • The design and engineering processes that bridges undergo are supposed to ensure that bridge failures do not happen.
Controlled Experiments • After the bridge collapse, investigators needed to use scientific inquiry to determine why the bridge failed. • They designed controlled experiments to help them answer questions and test their hypotheses. • A controlled experiment is a scientific investigation that tests how one factor affects another.
Identifying Variables & Constants • A variable is any factor that can have more than one value. • The independent variable, the factor that you want to test, is changed by the investigator to observe how it affects a dependent variable • The dependent variable is the factor you observe or measure during an experiment. • Constants are the factors in an experiment that do not change.
Experimental Groups • A controlled experiment has at two groups: • The experimental group is used to study how a change in the independent variable changes the dependent variable. • The control group contains the same factors as the experimental group, but the independent variable is not changed.
Simple Beam Bridges • A beam bridge has one horizontal beam across two supports. • It is the most simple bridge, but… • A disadvantage is that they tend to sag in the middle if they are too long.
Truss Bridges • A truss bridge often spans long distances. • It is supported only at its two ends, but an assembly of interconnected triangles, or trusses, strengthens it. • The I-35W bridge was a truss bridge designed in the early 1960s.
Bridge Failure Observations • After recovering all the pieces of the collapsed bridge, investigators found physical evidence they needed to determine where the breaks in each section of the bridge occurred. • Investigators also used video footage of the bridge collapse to help pinpoint where the collapse began. Video Footage
Asking Questions • Was the original bridge design faulty? • Was there too much weight on the bridge? • Was there proper bridge maintenance?
Gathering Information & Data • Investigators collected and analyzed both qualitative and quantitative data. Qualitative Data: Uses words to describe what is observed. • A thick layer of concrete reinforced the bridge rods. Quantitative Data: Uses numbers to describe what is observed. • Gusset Plate U10 experienced Demand-to-Capacity ratios ranging from 1.30 – 1.83.
An Early Hypothesis • The bridge failed, because it was overloaded. • Normal Traffic • Construction Equipment for Renovations • Sand • Gravel • Water Tanker • Concrete Mixer
Computer Modeling • Investigators entered data into a computer model, which performed mathematical calculations to determine that the bridge was not overloaded. • The investigators needed a new Hypothesis
Revising the Hypothesis • Investigators reviewed historical photos and physical evidence at the time of the collapse. • Photos showed bowed gusset plates in 1999 and 2003. • Several gusset plates fractured during the collapse. New Hypothesis: The gusset plates failed, which led to the bridge collapse.
Testing the Hypothesis Independent Variable: Demand on the bridge at the time of the collapse Bridge Mass + Occupancy Mass = Demand Dependent Variable: Demand-to-Capacity Ratio • Values greater than 1.00 indicate a safety concern
Analyzing Results • The U10 gusset plates should have been twice as thick to support the bridge and it’s occupants.
Drawing Conclusions • The bridge failed, because the gusset plates were not properly designed and they could not carry the load they were supposed to carry. • Because the NTSB published and communicated their results, the scientists and engineers have valuable information as they design and build future bridges.
Pop Quiz Which is changed to observe how it affects a dependent variable? A.constant B. control group C. experimental group D. independent variable
Pop Quiz Which refers to data that use words to describe what is observed? A. control group B. dependent variable C. qualitative data D.quantitative data
Pop Quiz Which term refers to any factor that can have more than one value? A.constants B.control group C.experimental group D.variable