FACTORIAL ANOVA
FACTORIAL ANOVA. Overview of Factorial ANOVA. Factorial Designs Types of Effects Assumptions Analyzing the Variance Regression Equation Fixed and Random Effects. FACTORIAL DESIGNS. All combinations of levels of two or more independent variables (factors) are measured.


FACTORIAL ANOVA
E N D
Presentation Transcript
Overview of Factorial ANOVA • Factorial Designs • Types of Effects • Assumptions • Analyzing the Variance • Regression Equation • Fixed and Random Effects
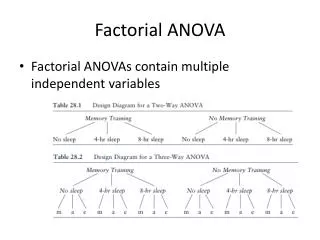
FACTORIAL DESIGNS • All combinations of levels of two or more independent variables (factors) are measured
Types of Factorials • Between subjects (independent) • Within subjects (related) • Mixed
Between Subjects A 1 2 Subjects 1-10 Subjects 21-30 1 B Subjects 11-20 Subjects 31-40 2
Within Subjects A 1 2 Subjects 1-40 Subjects 1-40 1 B Subjects 1-40 Subjects 1-40 2
Mixed (A Between, B Within) A 1 2 Subjects 1-20 Subjects 21-40 1 B Subjects 1-20 Subjects 21-40 2
Review! I am planning a 2 x 3 factorial design and I want to have 20 participants per condition. How many total participants do I need: • For a between subjects design? • For a within subjects design? • For a mixed design where the between factor has two levels?
TYPES OF EFFECTS • A main effect is the overall effect of each IV by itself, averaging over the levels of any other IVs. • An interaction occurs when the effects of one factor change depending on the level of another factor.
Simple Effects • An interaction can be understood as a difference in simple effects. • A simple effect is the effect of one factor on only one level of another factor. • If the simple effects differ, there is an interaction.
70 60 50 B2 40 d.v. 30 B1 20 10 0 1 2 A
70 B2 60 50 40 B1 d.v. 30 20 10 0 1 2 A
B2 70 60 50 40 d.v. 30 B1 20 10 0 1 2 A
70 60 B2 50 40 d.v. 30 20 B1 10 0 1 2 A
Review! For the graph on the following slide, describe each of the following: • Main effect of gender of toucher. • Main effect of type of touch. • Interaction of gender of toucher with type of touch.
ASSUMPTIONS • Interval/ratio data • Normal distribution or N at least 30 • Independent observations • Homogeneity of variance • Proportional or equal cell sizes
ANALYZING THE VARIANCE • Total Variance = Model + Residual • Model Variance is further divided into: • Factor A • Factor B • A x B interaction
Comparing Variance • F-test for each main effect and for the interaction • Each F-test compares variance for the effect to Residual variance
REGRESSION EQUATION • bo is mean of base group • b1 is the main effect of factor A • b2 is the main effect of factor B • b3 is the A x B interaction
FIXED VS. RANDOM EFFECTS • Fixed Factor: only the levels of interest are selected for the factor, and there is no intent to generalize to other levels • Random Factor: the levels are selected at random from the possible levels, and there is an intent to generalize to other levels
Review! Fixed Factor ANOVAs are much more common than Random Factor ANOVAs. Why do you think that is?
APA Format Example The two-way between subjects ANOVA showed a significant main effect of customer type, F(1,1482) = 5.04, p = .025, partial h2 = .00, a non-significant main effect of industry type, F(2,1482) = 0.70, p = .497, partial h2 = .00, and a significant interaction, F(2,1482) = 3.12, p = .044, partial h2 = .00.
Choosing Stats Participants respond to a 20-item scale of superstitious beliefs. The researcher would like to determine if there is internal consistency in responses to the 20 items. In other words, are people who believe in some superstitions likely to also believe in other superstitions?