Download
1 / 18
180 likes | 358 Vues
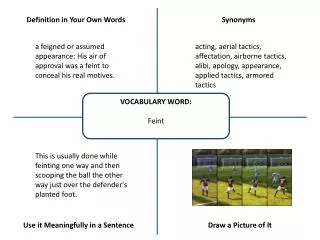
Part A . In your own words, briefly describe the content and purpose of each section. 1. PROBLEM : What you’re trying to solve, question 2. Gather information 3 . HYPOTHESIS : Educated guess (If…..then….) 4. EXPERIMENT : Testing the hypothesis. a. control group :

E N D
Part A. In your own words, briefly describe the content and purpose of each section. 1. PROBLEM: • What you’re trying to solve, question 2. Gather information 3. HYPOTHESIS: • Educated guess (If…..then….) 4. EXPERIMENT: • Testing the hypothesis
a.control group: • Group that doesn’t contain the IV, used to compare b.experimental group: • group that contains the IV c.independent variable: • What’s different in each group • What you’re testing d. dependent variable: • What’s being measured
5. OBSERVATIONS: • organizing and analyzing data in charts and graphs 6. CONCLUSION: • Stating whether or not hypothesis is right or wrong and why 7. Repeat
Part B. 1. What can be done to make a experiment a more valid one? • Repeat, increase sample size
2. Problem: Will bread last longer if it is kept in the refrigerator? For this experiment, identify the: • IV: • temperature b. DV: • How long bread will last/time c. Experimental Group: • Bread in refrigerator d. Control Group: • Bread at room temperature e. Constants: • Type of bread, same container
3. Mrs. Wood keeps a container of crickets in the science lab so she can feed the critters. Lately they are chirping more than usual. She remembers reading somewhere that the chirping of crickets depends on the air temperature at which they live. You want to do a controlled experiment to see if this is true. a. Write a PROBLEM for the investigation. • Does temperature affect the chirping of crickets? b. Write a hypothesis for your question. • If you increase the temperature, then the crickets will chirp more.
c. What is the independent variable? • temperature d. What is the dependent variable? • # of chirps e. What is the experimental group? • Crickets at different temperatures f. What is the control group? • Crickets at room temperature e. List at least two constants for this investigation. • Type of crickets, food
4. The table below contains data from Mrs. Wood’s investigation. Use this data to answer the questions below. Which graph has properly labeled axes? Circle your choice.
5. What would be a good title for a graph representing this data? • The Effect of Temperature on the chirping of crickets
Parts C. 1. What is the length of the object below? • 3.1cm
2. Calculate the volume of the object below. Show all work. • V = l x w x h • V = 3.4cm x 12.9cm x 4.0cm • V = 175.4 cm3
8 3. What is the volume of the liquids below? 6 a. 32 mL a. 7.6 mL
5. What is the mass shown on the triple beam balance below? 332.8 g
6. Convert the following measurements. a. 68 g = __________kg • 0.068 kg b. 568 cm = __________ m • 5.68 m c. 8700 ml = __________ l • 8.7 L
7. At what temperature does water freeze? (in degrees Celsius and Fahrenheit) • 0°C, 32°F 8. At what temperature does water boil? (in degrees Celsius and Fahrenheit) • 100°C, 212°F 9. What is the average human body temperature? (in degrees Celsius and Fahrenheit) • 37°C, 98.6°F
11. Graphing In an investigation, plants of the same species and the same initial height were exposed to a constant number of hours of light each day. The number of hours per day was different for each plant, but all other environmental factors were the same. At the conclusion of the investigation, the final height of each plant was measured. The following data were recorded: • Using the information given, construct a line graph on the grid provided, following the directions below. • a. Mark an appropriate scale on each axis. • b. Label each axis with the appropriate units. • c. Plot the data for final height on the grid. Surround each point with a small circle and connect the points. • d. Create a title for this graph. Write it in the space provided above the graph.
40 d. TITLE: The Effect of Light Exposure in Plants Growth 35 30 Height (cm) 25 20 e. What is the dependent variable? 15 height 10 f. What type of relationship exists between the 2 variables in this experiment? 5 2 4 6 8 10 12 14 16 Direct relationship Daily Light Exposure (hrs)