Recent Advances in Modeling Time-Resolved Shielded Pickup Measurements of Electron Cloud Buildup
10 likes | 136 Vues
This paper presents recent developments in the modeling of time-resolved shielded pickup measurements focused on electron cloud buildup at CESRTA. We optimize the ECLOUD modeling code to accurately determine the kinetic energy distribution of photoelectrons produced by reflected photons. Key findings include disentangling the photoelectron production kinetic energy from beam kick strengths and establishing constraints on secondary electron production. The impact of photoelectron and secondary electron dynamics on the leading bunch signal shape is analyzed, leading to refined parameters for better modeling accuracy.

Recent Advances in Modeling Time-Resolved Shielded Pickup Measurements of Electron Cloud Buildup
E N D
Presentation Transcript
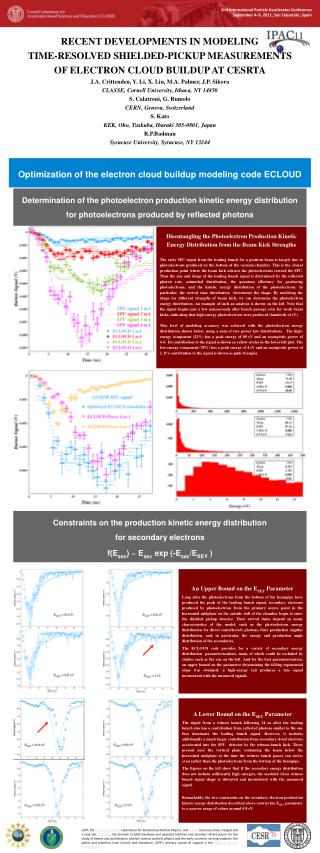
RECENT DEVELOPMENTS IN MODELING TIME-RESOLVED SHIELDED-PICKUP MEASUREMENTS OF ELECTRON CLOUD BUILDUP AT CESRTA J.A. Crittenden, Y. Li, X. Liu, M.A. Palmer, J.P. Sikora CLASSE, Cornell University, Ithaca, NY 14850 S. Calatroni, G. Rumolo CERN, Geneva, Switzerland S. Kato KEK, Oho, Tsukuba, Ibaraki 305-0801, Japan R.P.Badman Syracuse University, Syracuse, NY 13244 Optimization of the electron cloud buildup modeling code ECLOUD Determination of the photoelectron production kinetic energy distribution for photoelectrons produced by reflected photons Disentangling the Photoelectron Production Kinetic Energy Distribution from the Beam Kick Strengths The early SPU signal from the leading bunch for a positron beam is largely due to photoelectrons produced on the bottom of the vacuum chamber. This is the closest production point where the beam kick attracts the photoelectrons toward the SPU. Thus the size and shape of the leading bunch signal is determined by the reflected photon rate, azimuthal distribution, the quantum efficiency for producing photoelectrons, and the kinetic energy distribution of the photoelectrons. In particular, the arrival time distribution determines the shape. By modeling the shape for different strengths of beam kick, we can determine the photoelectron energy distribution. An example of such an analysis is shown on the left. Note that the signal begins just a few nanoseconds after bunch passage even for weak beam kicks, indicating that high-energy photoelectrons were produced (hundreds of eV). This level of modeling accuracy was achieved with the photoelectron energy distribution shown below, using a sum of two power law distributions. The high-energy component (22%) has a peak energy of 80 eV and an asymptotic power of 4.4. Its contribution to the signal is shown as yellow circles in the lower left plot. The low-energy component (78%) has a peak energy of 4 eV and an asymptotic power of 2. It's contribution to the signal is shown as pink triangles. Constraints on the production kinetic energy distribution for secondary electrons f(Esec) ~ Esec exp (-Esec/ESEY ) An Upper Bound on the ESEY Parameter Long after the photoelectrons from the bottom of the beampipe have produced the peak of the leading bunch signal, secondary electrons produced by photoelectrons from the primary source point in the horizontal midplane on the outside wall of the chamber begin to enter the shielded pickup detector. Their arrival times depend on many characteristics of the model, such as the photoelectron energy distribution for direct (unreflected) photons, their production angular distribution, and, in particular, the energy and production angle distribution of the secondaries. The ECLOUD code provides for a variety of secondary energy distribution parameterizations, many of which could be excluded by studies such as the one on the left. And for the best parameterization, an upper bound on the parameter determining the falling exponential slope was obtained: a high-energy tail produces a late signal inconsistent with the measured signals. A Lower Bound on the ESEY Parameter The signal from a witness bunch following 14 ns after the leading bunch also has a contribution from reflected photons similar to the one that dominates the leading bunch signal. However, it includes additionally a much larger contribution from secondary cloud electrons accelerated into the SPU detector by the witness-bunch kick. Those present near the vertical plane containing the beam below the horizontal midplane at the time the witness bunch passes can arrive even earlier than the photoelectrons from the bottom of the beampipe. The figures on the left show that if the secondary energy distribution does not include sufficiently high energies, the modeled 14-ns witness bunch signal shape is distorted and inconsistent with the measured signal. Remarkably, the two constraints on the secondary electron production kinetic energy distribution described above restrict the ESEY parameter to a narrow range of values around 0.8 eV.