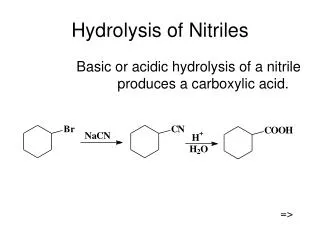
Enzymatic Hydrolysis
Enzymatic Hydrolysis. RET Laboratory Procedure. Safety to Consider. Broken glassware Be careful when handling glassware Chemical hazards Tetracycline and cycloheximide are antimicrobials and have low hazard properties However, ALWAYS wear laboratory gloves Hot plate

Enzymatic Hydrolysis
E N D
Presentation Transcript
Enzymatic Hydrolysis RET Laboratory Procedure
Safety to Consider • Broken glassware • Be careful when handling glassware • Chemical hazards • Tetracycline and cycloheximide are antimicrobials and have low hazard properties • However, ALWAYS wear laboratory gloves • Hot plate • Do not touch the hot plate Chemical Engineering Department RET Project
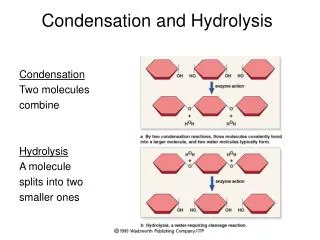
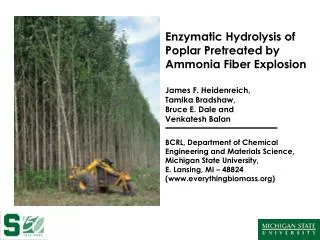
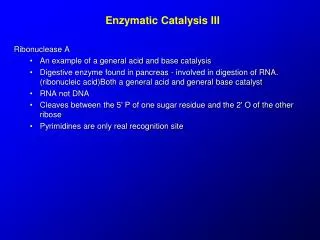
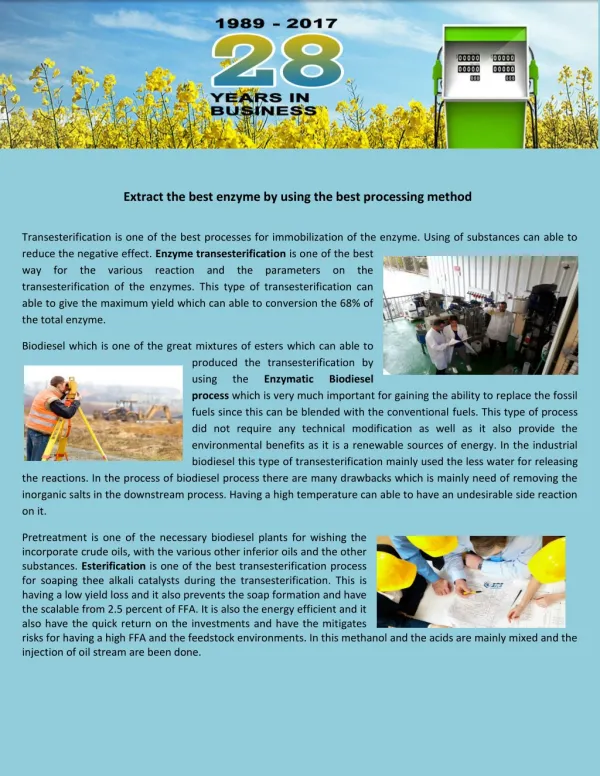
Experiment Background In this lab we will be using pretreated biomass and completing enzyme hydrolysis to breakdown the cellulose into glucose for use in fermentation. We are adding antimicrobials to the mix in order to prevent the growth of any bacteria that would potentially ferment the glucose right away. This will allow us to measure the amount of glucose that is produced. However due to the fact that antimicrobials are in this mix we cannot use this mixture in the fermentation process. This lab is to show students that cellulose is being broken down into glucose. In the real world production setting antimicrobials would not be used in enzyme hydrolysis. The mixture would be sterile from the pretreatment process and after the enzymatic hydrolysis flow directly into fermentation. Endo-glucanase enzymes break the cellulose molecules in the amorphous region. Cellobiohydrolase enzymes then break the cellulose into cellobiose, or dimers of glucose. Beta-glucosidase then finishes the conversion by separating the dimer into individual glucose molecules. Chemical Engineering Department RET Project
Procedural Outline • Glucose meter calibration • Solution preparation • Pre-treated biomass • Distilled water • 1M Sodium citrate buffer • Cycloheximide (antimicrobial) • Tetracycline (antimicrobial) • Prepare 50 °C water bath in pressure cooker • Enzyme addition: Accellerase BG and Accellerase 1500 • Glucose concentration measurement every 24 hours • Data Analysis • Sample Calculations Chemical Engineering Department RET Project
Glucose Meter Calibration • Prepare a 0.05 M sodium citrate buffer solution from the stock 1 M solution: • + = 1 mL of 1M sodium citrate buffer 19 mL of distilled water 20 mL of 0.05M sodium citrate buffer Chemical Engineering Department RET Project
Glucose Meter Calibration (2) • Prepare a 50 mL 4 g/L glucose solution in 0.05 M sodium citrate buffer solution: Dissolve 0.2 g of glucose in 50 mL 0.05M sodium citrate buffer Chemical Engineering Department RET Project
Glucose Meter Calibration (3) • Prepare the following calibration standards and measure glucose concentration using the glucose meter: Note: Shake the standards well Chemical Engineering Department RET Project
Glucose Meter Calibration (4) • Prepare a calibration curve and obtain equation for best fit line Chemical Engineering Department RET Project
Solution Preparation • Transfer 1 gram of Aspen pre-treated wood chips to a 50 mL Erlenmeyer flask using 19 mL of distilled water (record the exact mass added) Chemical Engineering Department RET Project
Solution Preparation (2) • It is advisable to prepare two biomass solutions in order to compare the measurements taken from essentially duplicate solutions • A control may also be prepared to determine if and how the chemical additions affect the glucose measurements. The control contains all chemical additions except for the biomass, or wood chips Chemical Engineering Department RET Project
Solution Preparation (3) • Add 1 mL of 1M sodium citrate buffer solution to all flasks • Add 80 μL of tetracycline (10 mg/mL in 70% ethanol) to all flasks • Add 60 μL of cycloheximide (10 mg/mL in dH2O) to all flasks Chemical Engineering Department RET Project
Prepare 50 °C Water Bath in Pressure Cooker • Place the pressure cooker on top of the hot plate Note: pressure cooker should have a thin layer of water (≈ ½”) at its bottom to allow even heating on all sides of each flask • Set the hot plate to a temperature of 50 °C, assuring correct temperature by placing the thermometer tip into the pressure cooker Note: this may take some practice. It is advised to be able to maintain 50 °C in the pressure cooker before beginning the experiment Chemical Engineering Department RET Project
Enzyme Addition • I. Determine the dry weight of biomass added to flask using the following formula Dry mass = wet mass * (1 – % moisture content) Note: Biomass % moisture content is written on each biomass bag For example, if the wet mass added was 1.0 g and the moisture content was 73%: Dry mass = 1.3 g * (1 – 0.73) = 0.27 g Chemical Engineering Department RET Project
Enzyme Addition (2) • Add enzymes to the woodchip flask in the following loadings: Accellerase 1500: 250 μL per 1 gram of dry biomass Accellerase BG: 90 μL per 1 gram of dry biomass From the previous slide, the dry mass was 0.27 g: Add 250 μL · 0.27 = 67.5 μL of Accellerase 1500 Add 90 μL · 0.27 = 24.3 μL of Accellerase BG Chemical Engineering Department RET Project
How to use the Glucose Meter • For best results, use the dip method: • Dispense 10 µL of the solutions onto a piece of wax paper using the pipetter. Allow the sample to sit for 30 seconds to reach room temperature • Insert a strip into the glucose meter Chemical Engineering Department RET Project
How to use the Glucose Meter (2) • “Dip” the end of the test strip into the solution on the wax paper • Record the results in your laboratory notebook Chemical Engineering Department RET Project
Glucose Measurement • After each glucose measurement cover each flask with tin/aluminum foil and wrap a strip of parafilm around the top of each flask to prevent evaporating material from escaping Chemical Engineering Department RET Project
Glucose Measurement • Measure the initial glucose concentration using the glucose meter at t = 0 hours • Place the flask back into the pressure cooker for 24 hours (at 50 °C) • Measure the glucose concentration using the glucose meter at t = 24 hours • Repeat steps II and III at t = 48 hours and t = 72 hours Note: The meter may read “HI” when measuring. If so, use a 1.5 mL microcentrifuge tube to dilute a small portion of the biomass solution with the 0.05 M sodium citrate buffer solution to obtain readable results. For example, make a 1:1 diluted solution by mixing 0.5 mL of the biomass solution with 0.5 mL of the 0.05 M sodium citrate buffer solution, then test that. If this measurement is still outside the range of the glucose meter, continue diluting the solution to lesser concentrations until a readable measurement can be made. If the meter reads “Lo”, assume the glucose concentration is 0 g/L. Chemical Engineering Department RET Project
Data Analysis • Using the glucose measurement data that was collected and the calibration curve that was obtained for this batch of test strips, determine the glucose concentration of each glucose meter measurement in g/L Chemical Engineering Department RET Project
Data Analysis (1) • The glucose concentration during the measured time period can now be plotted to view how the hydrolysis progressed over time Chemical Engineering Department RET Project
Data Analysis (2) • Assume the volume in each flask is 20 mL • Using the volume and final (48 or 72 hrs) net glucose concentration, calculate the amount of glucose produced in each flask • Determine the theoretical mass of glucose that could have been produced from a dry biomass basis Note: assume biomass is 50% cellulose and 50% lignin theoretical mass of glucose that could be produced Chemical Engineering Department RET Project
Data Analysis (3) • Determine the percent yield of glucose production Chemical Engineering Department RET Project
Sample Calculations • The sample calculations will be performed on Biomass #1 at the 48 hour measuring period • Calculate the glucose concentration in g/L using the calibration curve • Calculate the net glucose concentration in g/L Chemical Engineering Department RET Project
Sample Calculations (1) • Calculate the amount of glucose produced in the flask • Calculate the theoretical mass of glucose that could have been produced • Calculate the percent yield Chemical Engineering Department RET Project
Acknowledgements Funding from the National Science Foundation “RET Site: “Wood-to-Wheels” – Research Experiences for High School Teachers in Sustainable Transportation Technologies” Grant no. EEC-1009617 Chemical Engineering Department RET Project