Biogeochemical Cycles
Biogeochemical Cycles. 20 essential inorganic elements for living organisms. Unlike energy - essentially no input of inorganic nutrients Essential elements present in finite amounts recycled from dead tissue and wastes. Earth’s ecosystems are maintained by a constant influx of energy.

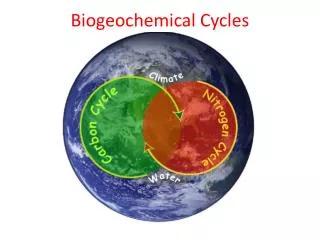
Biogeochemical Cycles
E N D
Presentation Transcript
Biogeochemical Cycles • 20 essential inorganic elements for living organisms. • Unlike energy - essentially no input of inorganic nutrients • Essential elements present in finite amounts • recycled from dead tissue and wastes
Earth’s ecosystems are maintained by a constant influx of energy Transformation Loss of Energy Solar Energy Autotroph Herbivore Carnivore Respiratory Loss
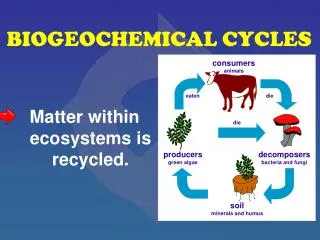
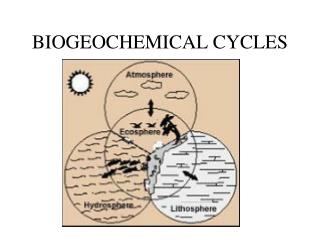
Biogeochemical Cycles Decomposition Respiration Excretion Biotic Cycling of chemical elements between living and non-living portions of the earth’s ecosystems Uptake Abiotic
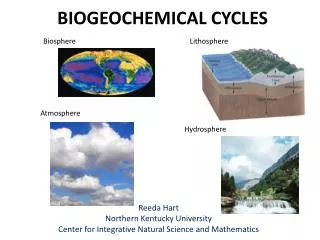
Abiotic Reservoirs for Essential Elements • Lithosphere (bedrock and soil) • Atmosphere • Hydrosphere (especially the ocean)
Carbon CycleWhere do we find carbon? • Air (carbon dioxide) • Dissolved in water: • Carbonic acid • Carbonate and bicarbonate ions • Rocks and soil: • e.g. limestone calcium carbonate • Fossil fuel deposits: • Coal, oil, natural gas • Living organisms - organic molecules: • Carbohydrates, proteins, fats)
Relative amounts of carbon in Reservoirs and living and dead Tissues • Atmosphere = 1 • Living organisms = 0.66 • Decaying Organic Matter = 6.7 • Fossil Fuels =14.3 • Ocean Waters = 50 • Carbonate Sediments (limestone) = 29,000,000
Types of Reservoirs • Active Reservoirs • Storage Reservoirs
Active Reservoirs for Carbon • Atmosphere • Carbon dioxide • Hydrosphere • Carbon dioxide • Bicarbonate ions • Carbonate ions
Storage Reservoirs for Carbon • Carbonate rocks • limestone • Fossil fuels • Coal • Oil • Natural Gas
Chemicals move from one abiotic Reservoir to another CO2 Atmosphere Hydrosphere Carbonic acid Bicarbonate ion Carbonate ion + Calcium Sedimentary Rock (Limestone) Volcanic Activity Calcium Carbonate
The Carbon Cycle • Atmosphere contains • 0.037% (370 ppm) carbon dioxide • @720 trillion kg Carbon • Annually in photosynthesis • @120 trillion kg of carbon – • 1/6 of atmospheric CO2
Why photosynthesis does not deplete atmospheric CO2 • Rapid recycling (high Mobility) • Biotic and Abiotic • Oceans stabilize atmospheric concentration • Release from storage reservoirs
Reason 1: There is great mobility of carbon 120 trillion kg Photosynthesis removes CO2 from the atmosphere Solar Energy CO2 + H2O carbohydrate + oxygen Chlorophyll
Reason 1: There is great mobility of carbon Respiration/Decomposition returns CO2 to the atmosphere Carbohydrate + Oxygen CO2 + H2O Plants 60 trillion kg heterotrophs (decomposers) 60 trillion kg
Balance between photosynthesis and respiration • Plants remove 120 trillion kg of Carbon • Photosynthesis • Respiration returns 120 trillion kg of Carbon • Plant respiration 60 trillion kg of Carbon • Heterotrophic respiration 60 trillion kg of Carbon
Seasonal Variation in atmospheric carbon dioxide Maximum Photosynthesis Conc. carbon dioxide J F M A M J J A S O N D Month
Carbon is stored in more forms than just CO2 in the oceans Atmosphere Carbonic Acid Ocean bicarbonate ion Co2 + H2O H2CO3 H+ + HCO3 H+ + Co3 (carbonate ion) Reactions are reversible
Oceans help stabilize Levels of Atmospheric CO2 Ocean Atmosphere Ocean Atmosphere Equilibrium Ocean Atmosphere
Aquatic/Atmospheric Reservoirs 30 to 50% of Atmospheric carbon dioxide in the ocean in a few years Currently a Net flux of carbon into ocean Carbon Dioxide Net Flux 2 trillion kg 107 trillion kg Atmosphere OCEAN 105 trillion kg
3. Release from storage Reservoirs: Fossil Deposits Fossil fuels Coal, oil and natural gas Carboniferous - 345-280 million YBP Carbonate rock Shells of marine animals Limestone and Dolomite Slow exchange Carbon “locked up” for millions of years
Amounts in the Storage PoolsCompared to the Atmosphere (Atmosphere = 1) Fossil Fuels (14.3) Carbonate Sediments (29,000,000)
How Does Carbon Get From the Storage Reservoirs to the Active Reservoirs? • Burning of fossil fuels • Subduction and volcanic activity
Plate tectonics • Plate tectonics • Move apart • Slide past • Override (subduction)
Changes in atmospheric carbon dioxide • In the past 150 years, there has been a substantial increase in atmospheric carbon dioxide
Reasons for Increased Atmospheric CO2 • Increases in past 140-150 years because of: • Deforestation • Currentmostly tropical regions Agricultural expansion • Industrialization (about 75%)
Estimates of Carbon ReservoirsTrillion kg of carbon • Soil Organic Carbon 1,500 • Litter 100 • Live Biomass 650 • Total 2,250 • Atmosphere 720 • Soil + litter + live biomass (2,250 ) is 3X’s the atmosphere (720)
Forests as Carbon Sinks Carbon dioxide Tree Carbon dioxide Photosynthesis Carbon is stored in the plant’s tissues (roots, stems, and leaves) Plant respiration Decomposer respiration Carbon is incorporated into the soil
Young Forests and Mature Forests Gross Primary Production Net Primary Production Carbon Respiration YOUNG MATURE
Young Forests and Mature Forests Carbon Removed from the atmosphere Gross Primary Production Biomass Carbon Respiration YOUNG MATURE
Forests as carbons sinks (Mature Vs. Young Forests) • Young forests • Accumulate more carbon than they give off in respiration • Represent smaller “carbon sinks” • Mature forests • Approximate balance between photosynthesis and respiration • Larger sinks for carbon
Cutting and Burning Forest returns large amounts of carbon to the atmosphere • What happens when forests are converted to cropland?
Reasons for increased carbon dioxide • Industry • Fossil fuel burning 6.9-7.0 trillion kg of carbon (77%) • Deforestation • 1.8-2.0 trillion kg of carbon (22%) • mostly in tropical regions of the world • Consequences?
Greenhouse Glass Greenhouse Effect Solar Radiation long-wave radiation is absorbed 8-12 microns Energy Absorbed Carbon dioxide lets Short wave radiation pass through 0.1-7.0 microns
Greenhouse Gases In coming radiation Carbon dioxide Earth CO2 is essentially transparent to solar energy • Energy absorbed by carbon dioxide is radiated in all directions. • Some of this energy is absorbed by the earth causing the greenhouse effect.
Greenhouse Gases • Gas % Rel. Efficiency • Contribution • CO2 65% 1 • Methane (CH4) 20% 21 • Nitrous Oxide (N2O) 5% 270 • CFCs >5% 15,000 • CFC = Chlorofluorcarbons
Greenhouse Gases • Gas Atmospheric Conc. (ppm) • CO2 370 • CFCs 0.000225 • Methane* 1.6 • Nitrous Oxide 0.31
Methane Production (20% Global Warming) • Natural Sources (40%) • Decomposition of detritis • Human Sources (60%) • Land fills • Natural Gas Management • Livestock Production • Ruminant 25-500 liters/day • Manure Management • 37% of human sources • 2% of global warming
1996 (C02 from fossil fuels, cement production, gas flaring) RANK NATION CO2 TOT * CO2/ CAP** 1 UNITED STATES OF AMERICA 1446777 5.37 2 CHINA (MAINLAND) 917997 0.76 3 RUSSIAN FEDERATION 431090 2.91 4 JAPAN 318686 2.54 5 INDIA 272212 0.29 6 GERMANY 235050 2.87 7 UNITED KINGDOM 152015 2.59 8 CANADA 111723 3.76 9 REPUBLIC OF KOREA 111370 2.46 10 ITALY (INCLUDING SAN MARINO) 110052 1.92 11 UKRAINE 108431 2.10 12 FRANCE (INCLUDING MONACO) 98750 1.69 13 POLAND 97375 2.52 14 MEXICO 95007 1.02 Total* = 1,000 metric tons of carbon, metric tons per capita**
China surpassed USA’s emissions in 2006 by 8%, China’s CO2 emissions are now estimated to be about 14% higher than those from the USA
Current Total CO2 Emissions (2007)Five Leading Nations • Country Total (%) • China 24 • USA 21 • EU-15 15 • India 8 • Russian Federation 6% • Total 71%
Per capita Emission Top Five • Country Capita (metric tons) • USA 19.4 • Russia 11.8 • EU-15 8.6 • China 5.1 • India 1.8
How much CO2 does the earth’s atmosphere accumulate each year?