Download
1 / 33
330 likes | 454 Vues
This study investigates the historical catches of North Pacific blue whales (B. musculus) from 1905 to 1971, focusing on the eastern (ENP) and western (WNP) populations. Utilizing spatial Generalized Additive Models (GAMs) and incorporating acoustic data, we aim to differentiate stock identities amidst uncertainties related to date and location. Our findings suggest that better data and sensitivity analyses could refine ecological assumptions and enhance assessments of ENP and potentially WNP populations in the future, addressing the long-standing issue of conflated catch data.

E N D
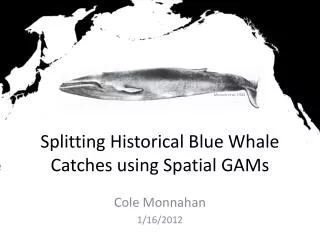
Splitting Historical Blue Whale Catches using Spatial GAMs Mizrochet al. 1984 Cole Monnahan 1/16/2012
Background/Motivation • North Pacific Blue whales (B. musculus) were exploited commercially from 1905-1971 • Endangered, but no assessment due in part to conflated catches Themes: • 2 Stocks: the eastern (ENP) and western (WNP) based on morphological¹ and acoustic² analyses • Uncertainty: date, location, statistical, ecological ¹ Gilpatrick & Perryman 2008, ² Stafford et al. 2001
Ecology WNP ENP
Floating Factories Photo: A. Berzin
Acoustic Data Locations Acoustic Hydrophones Goal: Infer stock identity of catches (using the acoustic data)
Acoustic Data Dates 1999/2001 GoA 1995/1996 NP 1995/1996 NP 1996/1997 Eastern Tropical Pacific (ETP)
Acoustic Spectrograms Image from: Stafford 2003, Two types of blue whale calls recorded in the Gulf of Alaska
Western population only in western Aleutians Eastern population only in ETP
Models • A priori predictors: Lat/Long and Month cover the spatial and temporal stock movements • Generalized Additive Models (GAM) • Over-dispersion is expected, so a beta-binomial distribution is used • Jackknifing bootstrapping to quantify statistical uncertainty of predictions
Binomial vs. Beta-Binomial Point: accounts for over-dispersion
GAM Models • AICsupports beta-binomial and GAM • GAMLSS [Rigby & Stasinopoulos 2002] in R • Separate models for ENP and WNP of form: The model predicts: the probability of observing a call at a given location/month in an hour.
Final Model The final probability of catch being ENP is then: Ecological Assumptions: • Populations call at the same rates • Relative population sizes stable over decades • Movement patterns stable over many decades • AB song distribution reflects all demographic groups
Ecological Uncertainty Deviations from α=1 lead to unexplained uncertainty Vary α to explore sensitivity to assumptions
Conclusions • This approach splits the catches and tries to accurately quantify the uncertainty • With more data, the ecological assumptions could be tested. But sensitivity analyses are best option. • It allows assessment of ENP (chapter 2!)…and maybe WNP in the future
Acknowledgements • Trevor Branch: Advice and funding • International Whaling Commission (IWC): Provided annual catch and individual database. • Kate Stafford (UW Applied Physics Lab): Raw acoustic data on call types (+ advice). • YuliaIvashchenko(NMML): Providing Soviet catch data • Andre Punt (UW SAFS): Suggesting the beta-binomial GAM And of course….