Download

1 / 9
90 likes | 247 Vues
Warm Up (worksheet) Use the data to find the line of best fit & answer the questions. Homework Check. Linear Regression. In yesterday’s lesson we discovered that finding the line-of-best-fit may lead to many "different" equations depending upon the points chosen to construct the line.

E N D
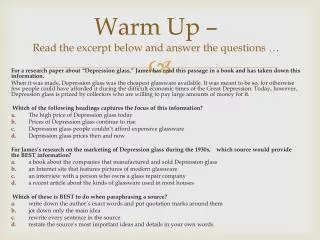
Warm Up (worksheet) Use the data to find the line of best fit & answer the questions.
In yesterday’s lesson we discovered that finding the line-of-best-fit may lead to many "different" equations depending upon the points chosen to construct the line. • The graphing calculator has the capability of determining which line will actually represent the REAL line-of-best-fit.
Is there a relationship between the fat gramsand the total calories in fast food?
Enter the data in the calculator lists. Place the data in L1 and L2. STAT, #1Edit, type values into the lists 2) Prepare a scatter plot of the data. Set up for the scatterplot. 2ndStatPlot - choices shown at right.Choose ZOOM #9 ZoomStat.
3) Have the calculator determine the line of best fit. STAT → CALC #4 LinReg(ax+b) ENTER 4) You now have the values of a and b needed to write the equation of the line of best fit. See values at the right.y = 11.73128088x + 193.8521475 5) Graph the line of best fit. Simply hit GRAPH.
Now, you try!Use your calculator to find the line of best fit.
What was the population in 2000? The table lists the population in Arizona from the year 1970 to 1994. Let 1970 be x = 0. Use your calculator to find the line of best fit.