Download

1 / 12
130 likes | 333 Vues
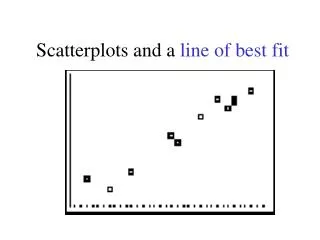
How to Determine the Line of Best Fit. AKA Least Squares. What is meant by “best” fit line? . Recall Grade 9 scatter plots Best fit line (by eye) Balance points above & below following general trend of plotted points Difficult to replicate No measure of correlation strength.

E N D
How to Determinethe Line of Best Fit AKA Least Squares
What is meant by “best” fit line? • Recall Grade 9 scatter plots • Best fit line (by eye) • Balance points above & below following general trend of plotted points • Difficult to replicate • No measure of correlation strength
What is meant by “best” fit line? • Mean fit line • Average (mean) all x-values, y-values to establish the mean point • Line of best fit “hinges” on this coordinate and follows the trend of plotted points • More repeatable but still no measure of correlation strength
What is meant by “best” fit line? • Median-Median line • Group data into thirds • Establish the Median x-value and Median y-value of each third • Plot the three “median” points • Place a ruler on the outer two “median” points to establish the slope • Slide the ruler (same slope) one third of the distance towards the middle median point • Highly repeatable • Still no measure of correlation strength
What is meant by “best” fit line? • Intuitively, we think close fit is a good fit. • We want a line with little space b/t the line and the points • The best fit line would have the least space b/t the line and the data points.
How to measure “least space”? • Three ways • Vertically in y-direction • Horizontally in x-direction • Perpendicular to the line used as the model • Vertically is best when looking at regression because our purpose when computing regression is to predict a y-value for a given x-value • The vertical distance is how far off the prediction would be from the actual points
How far off is it? • Example: • To compute the vertical distance for the point (2,9) to the line y=3x+2 • Sub in x=2, compute y=3(2)+2=8 • subtract the actual measured value of 9 • Thus the deviation is -1 • Negative b/c the predicted value is less than the actual value
Some will be + while others - • Depending on the line, some points will fall above making a + deviation, while others will be below making a – deviation • By simply summing the deviations we might get a sum of zero (when + offset -) providing a false sense of quality in our model
Sum the squares • To prevent this, we square each deviation and sum them together • In essence, summing the squared differences. • Which would be more desirable, small deviations or large? • This is known as the “Method of Least Squares” and is easily seen in Fathom
How is it done for a line? • Through calculus (but not in MDM4U) • Knowing that a straight line takes the general form y=mx+b • We need m & b
Example Suppose x is a dial setting on your freezer, and y is the resulting temperature in °F. Determine the equation of the least squares line. Confirm on TI-83+.
Example (cont) • To compute the correlation coefficient (AKA Pearson Coefficient)