Download
1 / 11
110 likes | 316 Vues
Correlation Coefficient and Line of Best Fit. Correlation Coefficient r. n - 1. r. if the slope is + or - Strength: between -1 and 1 Absolute value reflects strength Ex: -0.7 and 0.7 have the same strength. Notation: r xy Ex: if looking at SAT and GPA write: r SAT -GPA. r = 1.

E N D
Correlation Coefficient r n - 1
r • if the slope is + or - • Strength: between -1 and 1 • Absolute value reflects strength Ex: -0.7 and 0.7 have the same strength. • Notation: rxy Ex: if looking at SAT and GPA write: rSAT-GPA
r = 1 r = -0.54 r = 0.85
r = -.94 r = .42 r = -.33
r = 0.17 r = 0.69
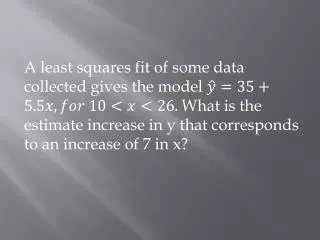
Calculating r Step 1: find the mean and standard deviation for x and y Step 2: find z-value for x and y Step 3: multiply the z values for each x and y pair Step 4: sum all zxzyand divide by (n-1) where n is the number of data values EX:
Best Fit Lineconditions • Can only use the line to make prediction when • Both variables are quantitative • The scatter plot is linear • No outlier is distorting results (you may have to take outliers out to check)
Best Fit LineakaLeast Squares Regression Line • A straight line on a graph showing the general direction that a group of points seem to be heading. • The equation for the line: y = mx + b where: m = r (sy/sx) where: b = y - mx • Use the line to predict values that are not on the scatter plot
AxisBest Fit Liney = 0.90x +1 The two variables are reflected on the x and y axis: