Download

1 / 7
70 likes | 414 Vues
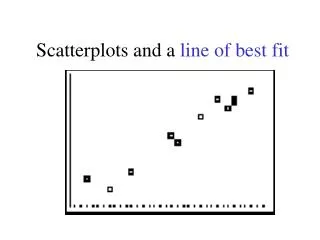
Line of Best Fit. Unit 8, Day 4. Definition:. Line of Best Fit or a trend line is a straight line on a Scatter plot that comes closest to all of the points on the graph. A Line of Best Fit may pass through some of the points, none of the points or all of the points.

E N D
Line of Best Fit Unit 8, Day 4
Definition: • Line of Best Fit or a trend line is a straight line on a Scatter plot that comes closest to all of the points on the graph. • A Line of Best Fit may pass through some of the points, none of the points or all of the points.
Line of Best Fit on Calculator 1. Enter the data in the calculator lists. 2. Prepare a scatter plot of the data.
y = 11.73x + 193.85 The graph will look like this. 3. Have the calculator determine the line of best fit. • Press STAT → CALC #4 LinReg(ax+b) • Type L1, L2, Y1. (Y1 comes from VARS → YVARS, #Function, Y1)
No. of Crimes Year 1995 5275.9 1996 5086.6 1997 4930.0 1998 4619.3 1999 4266.8 Another Example: Use a graphing calculator to find the equation of the line of best fit for the data. U.S. Crime Rate (per 100,000 inhabitants) Step 1: Let 95 correspond to 1995. Enter the data for years and then enter data for crimes. Step 2: Find the equation for the line of best fit. [Source: Crime in the United States, 1999, FBI, Uniform Crime Reports] y= –248.55x + 28,945.07 for values a and b rounded to the nearest hundredth.
You Try: • Suppose you are the diving officer on board a submarine conducting diving operations. As you conduct your operations you realize that you can relate the submarine’s changes in depth over time Use a graphing calculator to find the equation of the line of best fit for the data.