Download
1 / 9
420 likes | 1.65k Vues
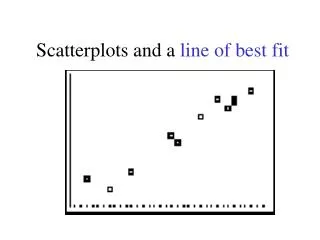
The Line of Best Fit. Linear Regression. Definition - A Line of Best or a trend line is a straight line on a Scatter plot that comes closest to all of the dots on the graph. A Line of Best Fit may pass through some or the points, none of the points or all of the points.

E N D
The Line of Best Fit Linear Regression
Definition - A Line of Best or a trend line is a straight line on a Scatter plot that comes closest to all of the dots on the graph. • A Line of Best Fit may pass through some or the points, none of the points or all of the points. • You can find the line of best fit by hand (paper and pencil) or with your graphing calculator.
A Line of Best Fit is useful because it allows us to: • Understand the type and strength of the relationship between two sets of data • Predict missing Y values for given X values, or missing X values for given Y values
How do you determine the best-fit line through data points? Fortunately technology, such as the graphing calculator and Excel, can do a better job than your eye and a ruler! y-variable x-variable
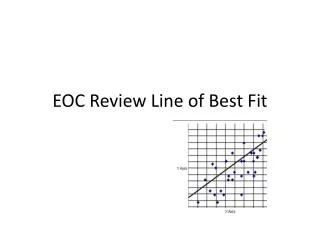
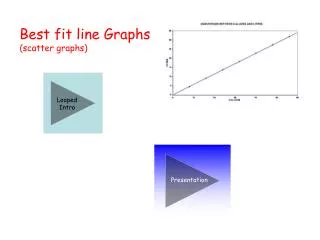
Line of Best Fit by Hand • Create your scatter plot of the data provided. • Using a ruler (upright), position it so that the plotted points are as close to the ruler as possible. • Draw the line of best fit • Find 2 points that you think would be on your best fit line. • Find the slope of the 2 points. • Plug the slope and one point into point slope formula y-y1=m(x-x1) to find the equation of the line. • Put the equation in slope intercept form (solve for y)
Line of Best Fit on Calculator 1. Enter the data in the calculator lists. Place the data in L1 and L2. STAT, #1Edit, type values into the lists 2. Prepare a scatter plot of the data. Set up for the scatterplot. 2nd StatPlot - choose the first icon – choices shown at right. Choose ZOOM #9 ZoomStat.
Graph will look something like this. 3. Have the calculator determine the line of best fit. STAT → CALC #4 LinReg(ax+b) Include the parameters L1, L2, Y1. (Y1 comes from VARS → YVARS, #Function, Y1)
You now have the values of a and b needed to write the equation of the actual line of best fit. Example: See values at right and substitute for a and b y = 11.73x + 193.85 (2 decimal places) NOTE: Graphing calculators use ‘a’ instead of ‘m’ for slope 4. Graph the line of best fit. Simply hit GRAPH.
Correlation Coefficient r r tells you how strong the relationship between the 2 variables is and how dependable the equation is. r is between -1 and 1. The closest it is to 0, the weaker the correlation. The closer it is to 1 or -1, the stronger the correlation. -1 0 1