Download
1 / 10
100 likes | 357 Vues
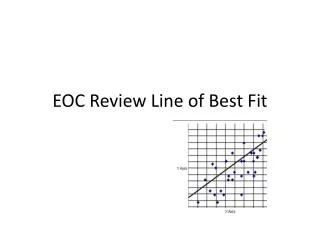
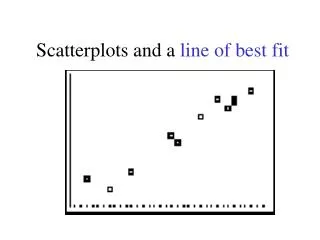
Scatterplots and a line of best fit. When data is displayed with a scatterplot , it is often useful to attempt tp represent the data with a straight line so we could predict values not displayed on a scatterplot. Such a line is called “ line of best fit ”.

E N D
When data is displayed with a scatterplot, it is often useful to attempt tp represent the data with a straight line so we could predict values not displayed on a scatterplot. Such a line is called “line of best fit”. A line of best fit is a straight line that best represents the data on a scatterplot. This line may pass through some of the points, none of the points or all of the points. Its best to try to get your line to pass through at least two of the points, but in the middle of all of them.
Sandwich Total Fat (g) Total Calories Hamburger 9 260 Cheeseburger 13 320 Quarter Pounder 21 420 Quarter Pounder with Cheese 30 530 Big Mac 31 560 Arch Sandwich Special 31 550 Arch Special with Bacon 34 590 Crispy Chicken 25 500 Fish Fillet 28 560 Grilled Chicken 20 440 Grilled Chicken Light 5 300 Is there a relationship between the fat grams and the total calories in fast food?
Can we predict the number of total calories based upon the total fat grams? Lets see! First, create a scatterplot of the data on a piece of graph paper.
1. Prepare a scatter plot of the data. 2. Using a strand of spaghetti, position the spaghetti so that the plotted points are as close to the strand as possible. 3. Find two points that you think will be on the "best-fit" line. 4. We’re going to choose the two point (9,260) & (30,530)
5. Calculate the slope of the line through your two points. rounded to three decimal places. We calculate slope using the slope formula y2 – y1 x2 – x1 (9 , 260) & (30 , 530) x1 y1 x2 y2 Remember a linearequation is written y = mx + b or y = a + bx slope y - intercept
6. Write the equation of the line. Remember we write equations as y =mx + b or y = a + bx Use the point-slope formula y – y1 = slope (x – x1) Our 2 points ( 9 , 260) & ( 30 , 530) x1 y1 x2 y2
Now we have the equation: y = 12.87(x – 9) + 260 Multiply 12.87 by both x and –9 to get this equation y = 12.87x – 115.83 + 260 y = 12.87x + 144.17 Now add 260 with –115.83 to get this equation This is the equation of the line we just made to fit the data! 7. This equation can now be used to predict information that was not plotted in the scatter plot.
Predicting: - If you are looking for values that fall within the plotted values, you are interpolating. - If you are looking for values that fall outside the plotted values, you are extrapolating.Be careful when extrapolating. The further away from the plotted values you go, the less reliable is your prediction. Using your best fit line, predict the total calories based upon 22 grams of fat. y = 12.87x + 144.17 y = 12.87 (22) + 144.17 Substitute 22 for x y = 427.141 This means that if you have a sandwich that has 22 grams of fat, it will have 427.141 calories.
So who has the Correct line of best fit In step 4 above, we chose two points to form our line-of-best-fit. It is possible, however, that someone else will choose a different set of points, and their equation will be slightly different. Your answer will be considered CORRECT, as long as your calculations are correct for the two points that you chose.