Download

1 / 16
160 likes | 237 Vues
Explore the concept of the Line of Best Fit in linear regression and its significance in analysis, predictions, interpolation, and residuals. Practice problems and examples illustrate how to interpret and apply this fundamental statistical tool effectively.

E N D
A completely black dog was strolling down Main street during a total blackout affecting the entire town. Not a single streetlight had been on for hours. As the dog crosses the center of the road a Buick Skylark with 2 broken headlights speeds towards it, but manages to swerve out of the way just in time. How could the driver see the dog to swerve in time?
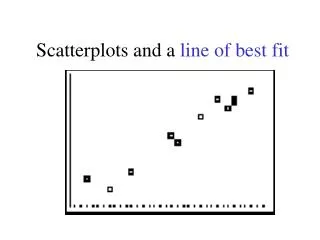
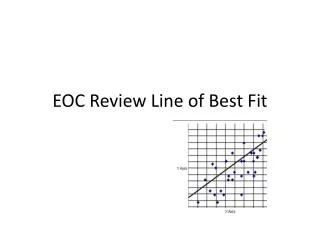
Continuing the Line of Best Fit • as a Predictor • Interpolation • Extrapolation • Residuals Why does this look like a good Line of Best Fit?
Line of Best Fit (Regression Line)Purpose • When scatter plots show what appears to be linear regression, we use a straight line to show the overall pattern of the data. • We can predict values from this mathematical model (y = mx+b) • Take your time to identify what x and y represent for each question
Review of y = mx+b • m represents = ________________________ • The slope of a regression line is only a predicted rate of change, rather than therate of change. • b represents = ________________________
Prediction • Interpolation – estimating predicted values between known values GOOD! • Extrapolation – estimating predicted values outside of known values BAD!!
Practice problem A group of 10 students was selected at random and asked for their high school GPA and their freshmen GPA in college the next year. • Is there a linear relationship between the high school GPA and the freshmen GPA? • What is the predicted college freshmen GPA, if we know that the high school GPA of a student is 3.4? • Is this prediction “interpolation” or “extrapolation”? Why?
Residuals • The distance between the points of a scatter plot and the Line of Best Fit. • A positive residual always falls above the line. A negative residual always falls below the line. • Examining the residuals helps assess how well the line describes the data Does a linear model (y = mx+b) describe the data? Residuals = Observed values – Predicted values
The distance in redrepresents the residual value for each data point. • The residuals above would be positive. • The residuals below would be negative.
From your packet: 9.3 Problem set #1 Line of Best Fit:
Residual Plot – helps to see if a linear model (y = mx + b) is appropriate y Things to look for in a residual plot: • No pattern: “snow” • Even distribution above and below the x axis x