Download

1 / 30
300 likes | 569 Vues
Line of Best Fit . Warm Up. Lesson Presentation. Lesson Quiz. Holt Algebra 1. Holt McDougal Algebra 1. Warm Up Identify the slope and the y-intercept . 1 . y = -2x + 1 2. y = x - 4. m = -2, b = 1. , b = -4. 2. 2. 3. m= . 3.

E N D
Line of Best Fit Warm Up Lesson Presentation Lesson Quiz Holt Algebra 1 Holt McDougal Algebra 1
Warm Up Identify the slope and the y-intercept. 1. y = -2x + 1 2. y =x - 4 m = -2, b = 1 , b = -4 2 2 3 m= 3 Identify the correlation (positive, negative, or none) that you would expect to see between each pair of data sets. 3. a person’s height and shoe size pos 4. the age of a car and its value neg
Objectives Determine a line of best fit for a set of linear data. Determine and interpret the correlation coefficient.
Vocabulary residual least-squares line line of best fit linear regression correlation coefficient
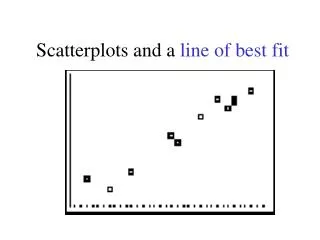
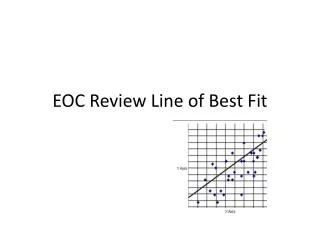
A residual is the signed vertical distance between a data point and a line of fit. The least-squares line for a data set is the line of fit for which the sum of the squares of the residuals is as small as possible. A line of best fitis the line that comes closest to all of the points in the data set, using a given process. Linear regressionis a process of finding the least-squares line.
The correlation coefficientis a number r, where -1 ≤ r ≤ 1, that describes how closely the points in a scatter plot cluster around a line of best fit.
Helpful Hint In By using squares of residuals, positive and negative residuals do not “cancel out” and residuals with squares greater than 1 have a magnified effect on the sum.
Example1: Calculating Residuals Two lines of fit for this data are y = 2x + 2 and y = x + 4. For each line, find the sum of the squares of the residuals. Which line is a better fit?
Example1: Continued Find the residuals y = x + 4: Sum of squared residuals: (2)2 + (–1)2 + (–1)2 + (1)2 4 + 1 + 1 + 1 = 7
Example1: Continued Find the residuals y = 2x + 2: Sum of squared residuals: (3)2 + (–1)2 + (–2)2 + (-1)2 9 + 1 + 4 + 1 = 15 The line y = x + 4 is a better fit.
Check It Out! Example 1 Two lines of fit for this data are For each line, find the sum of the squares of the residuals. Which line is a better fit? 1 2 Y = - x + 6 and y = -x + 8
Check It Out! Example 1 Continued Find the residuals. x + 6 : y = – 1 2 Sum of squared residuals: (–2)2 + (2)2 + (–2)2 + (2)2 4 + 4 + 4 + 4 = 16
Check It Out! Example 1 Continued Find the residuals. y = –x + 8: Sum of squared residuals: (–3)2 + (2)2 + (–1)2 + (4)2 9 + 4 + 1 + 16 = 30 x + 6 The line is a better fit y = - 1 2
Example 2: Finding the Least-Squares Line The table shows populations and numbers of U.S. Representatives for several states in the year 2000.
Example 2 Continued A. Find an equation for a line of best fit. Use your calculator. To enter the data, press STAT and select 1:Edit. Enter the population in the L1 column and the number of representatives in the L2 column. Then press STAT and choose CALC. Choose 4:LinReg(ax+b) and press ENTER. An equation for a line of best fit is y ≈ 1.56x + 0.02. y = 1.56x + 0.02
Example 2 Continued B. Interpret the meaning of the slope and y-intercept. Slope: for each 1 million increase in population, the number of Representatives increases by 1.56 million y-intercept: a state with a population of 0 (or less than a million) has 0.02 Representatives (or 1 Representative). C. Michigan had a population of approximately 10.0 million in 2000. Use your equation to predict Michigan’s number of Representatives. 16
Check It Out! Example 2 The table shows the prices and the lengths in yards of several balls of yarn at Knit Mart. a. Find an equation for a line of best fit. y ≈ 0.04x + 6.38
Check It Out! Example 2 Continue b. Interpret the meaning of the slope and y-intercept. Slope: cost is $0.04 yd y-intercept: $6.38 is added to the cost of every ball of yarn c. Knit Mart also sells yarn in a 1000-yard ball. Use your equation to predict the cost of this yarn.
Check It Out! Example 2 Continue y 0.04x + 6.38 y 0.04(1000) + 6.38 y $46.38 The average cost of 1000 yards of yarn is $46.38.
Helpful Hint r-values close to 1 or –1 indicate a very strong correlation. The closer r is to 0, the weaker the correlation.
Additional Example 3: Correlation Coefficient The table shows a relationship between points allowed and games won by a football team over eight seasons.
Additional Example 3 Continued Find an equation for a line of best fit. How well does the line represent the data? Use your calculator. Enter the data into the lists L1 and L2. Then press STAT and choose CALC. Choose 4:LinReg(ax+b) and press ENTER. An equation for a line of best fit is y ≈ –0.02x + 9.91. The value of r is about –0.91, which represents the data very well.
Check It Out! Example 3 Kylie and Marcus designed a quiz to measure how much information adults retain after leaving school. The table below shows the quiz scores of several adults, matched with the number of years each person had been out of school. Find an equation for a line of best fit. How well does the line represent the data?.
Check It Out! Example 3 Continued An equation for a line of best fit is y ≈ –2.74x + 84.32. The value of r is about –0.88, which represents the data very well.
Additional Example 4: Correlation and Causation Additional Example 4: Malik is a contractor, installing windows for a builder. The table shows data for his first eight weeks on the job. The equation of the least-squares line for the data is y ≈ -10.36x + 53, and r ≈ -0.88. Discuss correlation and causation for the data set.
Example 4 Continued There is a strong negative correlation. There is likely a cause-and-effect relationship (likely that less installation time contributes to a greater profit per hour).
Check It Out! Example 4 Eight adults were surveyed about their education and earnings. The table shows the survey results. The equation of the least-squares line for the data is y ≈ 5.59x - 30.28 and r ≈ 0.86. Discuss correlation and causation for the data set. There is a strong positive correlation. There is a likely cause-and-effect relationship (more education often contributes to higher earnings).
Lesson Quiz : Part-1 The table shows time spent on homework and number of incorrect quiz answers for several students. • Two lines of fit are y = -x + 11 and y = -0.5x + 8. Find the sum of the squares of the residuals for each line. Which line is a better fit? 18; 20; y = -x + 11
Lesson Quiz : Part-2 2. Find an equation for a line of best fit. Interpret the meaning of the slope and y-intercept. Use your equation to predict the number of incorrect answers for 5 hours of study. y ≈ -0.8x + 10.3; slope: for every hour of study, the number of incorrect answers decreases by 0.8; y-int.: a student who studies for 0 h will get 10.3 incorrect answers; 6.3
Lesson Quiz : Part-3 3. How well does the line of best fit represent the data? Explain. fairly well (r ≈ -0.79)