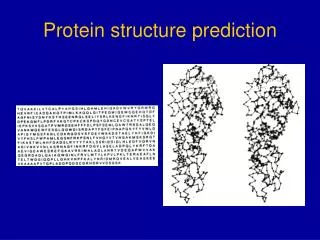
Protein structure prediction
Protein structure prediction. Scoring matrices workshop review

Protein structure prediction
E N D
Presentation Transcript
Protein structure prediction • Scoring matrices workshop review • Learning objectives-Understand the basis of secondary structure prediction programs. Become familiar with the databases that hold secondary structure information. Understand neural networks and how they help to predict secondary structure. • Workshop-Predict secondary structure of p53.
What is secondary structure? • Three major types: • Alpha Helical Regions • Beta Strand Regions • Coils, Turns, Extended (anything else)
Some Prediction Methods • ab initio methods • Based on physical properties of aa’s and bonding patterns • Statistics of amino acid distributions in known structures • Chou-Fasman • Sequence similarity to sequences of known structures • PSIPRED
Chou-Fasman • First widely used procedure • Output-helix, strand or turn • Percent accuracy: 60-65%
Psi-BLAST Predict Secondary Structure (PSIPRED) • Three steps: • 1) Generation of position specific scoring matrix. • 2) Prediction of initial secondary structure • 3) Filtering of predicted structure
PSIPRED • Uses multiple aligned sequences for prediction. • Uses training set of folds with known structure. • Uses a two-stage neural network to predict structure based on position specific scoring matrices generated by PSI-BLAST (Jones, 1999) • First network converts a window of 15 aa’s into a raw score of h,e (sheet), c (coil) or terminus • Second network filters the first output. For example, an output of hhhhehhhh might be converted to hhhhhhhhh. • Can obtain a Q3 value of 70-78% (may be the highest achievable)
Neural networks • Computer neural networks are based on simulation of adaptive • learning in networks of real neurons. • Neurons connect to each other via synaptic junctions which are either • stimulatory or inhibitory. • Adaptive learning involves the formation or suppression of the right • combinations of stimulatory and inhibitory synapses so that a set • of inputs produce an appropriate output.
Neural Networks (cont. 1) • The computer version of the neural network involves • identification of a set of inputs - amino acids in the • sequence, which transmit through a network of • connections. • At each layer, inputs are numerically • weighted and the combined result passed to the next • layer. • Ultimately a final output, a decision, helix, sheet or • coil, is produced.
Neural Networks (cont. 2) 90% of training set was used (known structures) 10% was used to evaluate the performance of the neural network during the training session.
Neural Networks (cont. 3) • During the training phase, selected sets of proteins of known structure are scanned, and if the decisions are incorrect, the input weightings are adjusted by the software to produce the desired result. • Training runs are repeated until the success rate is maximized. • Careful selection of the training set is an important aspect of this technique. The set must contain as wide a range of different fold types as possible without duplications of structural types that might bias the decisions.
Neural Networks (cont. 4) • An additional component of the PSIPRED procedures involves sequence alignment with similar proteins. • The rationale is that some amino acids positions in a sequence contribute more to the final structure than others. (This has been demonstrated by systematic mutation experiments in which each consecutive position in a sequence is substituted by a spectrum of amino acids. Some positions are remarkably tolerant of substitution, while others have unique requirements.) • To predict secondary structure accurately, one should place less weight on the tolerant positions, which clearly contribute little to the structure • One must also put more weight on the intolerant positions.
Provides info on tolerant or intolerant positions Row specifies aa position 15 groups of 21 units (1 unit for each aa plus one specifying the end) Filtering network three outputs are helix, strand or coil
Example of Output from PSIPRED PSIPRED PREDICTION RESULTS Key Conf: Confidence (0=low, 9=high) Pred: Predicted secondary structure (H=helix, E=strand, C=coil) AA: Target sequence Conf: 923788850068899998538983213555268822788714786424388875156215 Pred: CCEEEEEEEHHHHHHHHHHCCCCCCHHHHHHCCCCCEEEEECCCCCCHHHHHHHCCCCCC AA: KDIQLLNVSYDPTRELYEQYNKAFSAHWKQETGDNVVIDQSHGSQGKQATSSVINGIEAD 10 20 30 40 50 60
How to calculate Q3? Sequence: MEETHAPYRGVCNNM Actual Structure: CCCCCHHHHHHEEEE PSIPRED Prediction: CCCCCHHHHHHEEEH Q3 = 14/15 x 100 = 93%
Recognizing motifs in proteins. • PROSITE is a database of protein families and domains. • Most proteins can be grouped, on the basis of similarities in their sequences, into a limited number of families. • Proteins or protein domains belonging to a particular family generally share functional attributes and are derived from a common ancestor.
PROSITE Database • Contains 1087 different proteins and more than 1400 different patterns/motifs or signatures. • A “signature” of a protein allows one to place a protein within a specific function class based on structure and/or function. • An example of an entry in PROSITE is: http://ca.expasy.org/cgi-bin/nicedoc.pl?PDOC50020
A-T-H-[DE]-X-V-X(4)-{ED} This pattern is translated as: Ala, Thr, His, [Asp or Glu], any, Val, any, any, any, any, any but Glu or Asp How are the profiles constructed in the first place? Sequences are aligned manually by experts in field. Then a profile is created. ALRDFATHDDVCGK.. SMTAEATHDSVACY.. ECDQAATHEAVTHR..
Example of a PROSITE record ID ZINC_FINGER_C3HC4; PATTERN. PA C-x-H-x-[LIVMFY]-C-x(2)-C-[LIVMYA]
PROSITE Database Cont. 1 • Families of proteins have a similar function: Enzyme activity Post-translational modification Domains-Ca2+ binding domain DNA/RNA associated protein-Zn Finger Transport proteins-albumin, transferrin Structural proteins-fibronectin, collagen Receptors Peptide hormones
PROSITE Database Cont. 2 • FindProfile is a program that searches the ProSite database. It uses dynamic programming to determine optimal alignments. If the alignment produces a high score, then the match is given. http://www.expasy.ch/prosite/ • If a “hit” is obtained the program gives an output that shows the region of the query that contains the pattern and a reference to the 3-D structure database if available.
Other algorithms that search for protein patterns. • BLIMPs-A program that uses a query sequence to search the BLOCKs database. (written by Bill Alford) • BLOCKs- database of multiply aligned ungapped segments corresponding to the most highly conserved regions of proteins. • The blocks that comprise the BLOCKs Database are made automatically by searching for the most highly conserved regions in groups of proteins documented in the ProSite Database. • These blocks are then calibrated against the SWISS-PROT database to determine if such a sequence would occur by chance.
Example of entry in BLOCKS database Median of standardized scores for true positives Min and max dist to next block Family description ID p99.1.2414; BLOCK AC BP02414A; distance from previous block=(29,215) DE PROTEIN ZINC-FINGER NUCLEAR FIN BL LCC; width=27; seqs=8; 99.5%=1080; strength=1292 RPT1_MOUSE|P15533 ( 101) EKLRLFCRKDMMVICWLCERSQEHRGH 62 Y129_HUMAN|Q14142 ( 30) RVAELFCRRCRRCVCALCPVLGAHRGH 100 RFP_HUMAN|P14373 ( 101) EPLKLYCEEDQMPICVVCDRSREHRGH 49 RFP_MOUSE|Q62158 ( 110) EPLKLYCEQDQMPICVVCDRSREHRDH 51 RO52_HUMAN|P19474 ( 97) ERLHLFCEKDGKALCWVCAQSRKHRDH 54 RO52_MOUSE|Q62191 ( 101) EKLHLFCEEDGQALCWVCAQSGKHRDH 52 TF1B_HUMAN|Q13263 ( 215) EPLVLFCESCDTLTCRDCQLNAHKDHQ 65 TF1B_MOUSE|Q62318 ( 216) EPLVLFCESCDTLTCRDCQLNAHKDHQ 65 Sequence weight (higher number is more distant) Start position of the sequence segment
How does BLIMPS search the BLOCKS database? • It transforms each block into a position specific scoring matrix (PSSM). • Each PSSM column corresponds to a block position and contains values based on frequency of occurrence at that position. • A comparison is made between the query sequence and the BLOCK by sliding the PSSM over the query. • For every alignment each sequence position receives a score. • This sliding window procedure is repeated for all BLOCKS in the database.
Example of a pattern search using BLIMPS Note that any score less than 1000 may be due to chance. The score above 1000 is a score that is better than 95.5% of the true negatives.
3D structure data • The largest 3D structure database is the Protein Database • It contains over 20,000 records • Each record contains 3D coordinates for macromolecules • 80% of the records were obtained from X-ray diffraction studies and 20% were obtained from NMR studies.
Part of a record from the PDB ATOM 1 N ARG A 14 22.451 98.825 31.990 1.00 88.84 N ATOM 2 CA ARG A 14 21.713 100.102 31.828 1.00 90.39 C ATOM 3 C ARG A 14 22.583 101.018 30.979 1.00 89.86 C ATOM 4 O ARG A 14 22.105 101.989 30.391 1.00 89.82 O ATOM 5 CB ARG A 14 21.424 100.704 33.208 1.00 93.23 C ATOM 6 CG ARG A 14 20.465 101.880 33.215 1.00 95.72 C ATOM 7 CD ARG A 14 20.008 102.147 34.637 1.00 98.10 C ATOM 8 NE ARG A 14 18.999 103.196 34.718 1.00100.30 N ATOM 9 CZ ARG A 14 18.344 103.507 35.833 1.00100.29 C ATOM 10 NH1 ARG A 14 18.580 102.835 36.952 1.00 99.51 N ATOM 11 NH2 ARG A 14 17.441 104.479 35.827 1.00100.79 N
Workshops • Workshop A-Find the complete amino acid sequence of human p53 and perform a secondary structure prediction with a secondary structure prediction software program found on the ExPasy website. Have the results emailed to you or displayed on your computer.
Workshops • Workshop B-Check to see if the BLIMPs program in the BLOCK searcher can predict the function of PTEN (protein sequence accession number NP_000305). PTEN is an abbreviation for phosphatase and tensin homolog Obtain sequence from protein database at NCBI. Convert to FASTA format. Paste sequence into window in BLOCK Searcher (http://blocks.fhcrc.org/blocks/blocks_search.html). Determine the major function based on thee BLOCK Searcher output. Determine the actual function of PTEN by performing a text search for PTEN in the OMIM database. Did the BLOCK searcher correctly predict the function of PTEN?
Workshops • Workshop C-Calculation of Q3 value of secondary structure prediction program. Go to the Protein Data Bank (PDB) and obtain the record for the p53 crystal structure (1TSR). There are three identical p53 polypeptides in the record named A, B and C. Choose one of the polypeptides for this exercise. You can find the actual secondary structure of the polypeptide in the PDB record. Create a line graph that places the amino acid sequence in one row and the known secondary structure from the PDB record that amino acid in the next row. Next, use the predicted structure from Workshop B. Create a third row on the line graph that shows the predicted structure. The 1TSR file only contains the DNA binding domain of p53 so you will only be able to cover about half of the protein. If you can, obtain other portions of p53 where the structure has been solved from the Protein Data Bank (in different records) and fill in those regions in the second row that were not obtained in the 1TSR record. Show the instructor the line figure and calculate the percent accuracy of your secondary structure prediction. A hypothetical example is shown below Sequence: MEETHAPYRGVCNNM Actual Structure: CCCCCHHHHHHEEEE PSIPRED Predict.: CCCCCHHHHHHEEEH Percent accuracy: 14/15 X 100