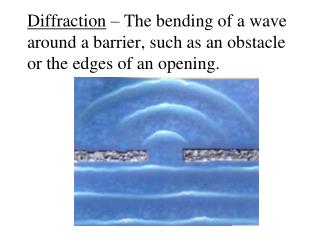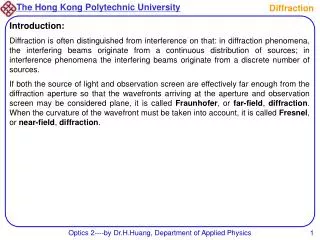

Diffraction
E N D
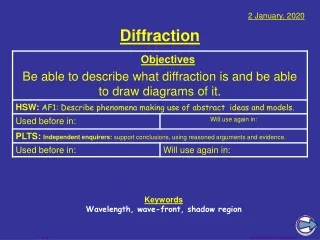
Presentation Transcript
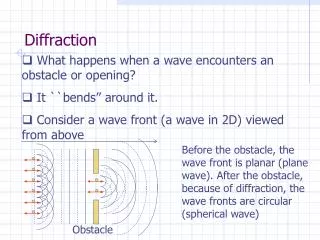
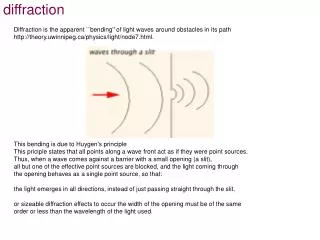
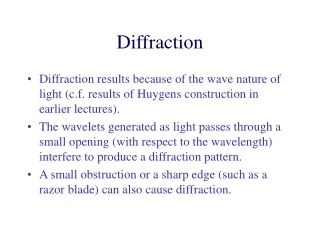
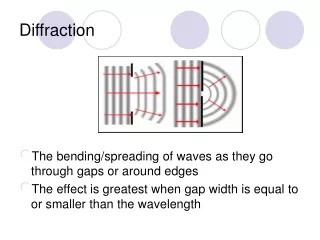
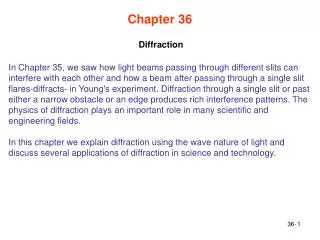
Diffraction Chapter 36 In Chapter 35, we saw how light beams passing through different slits can interfere with each other and how a beam after passing through a single slit flares-diffracts- in Young's experiment. Diffraction through a single slit or past either a narrow obstacle or an edge produces rich interference patterns. The physics of diffraction plays an important role in many scientific and engineering fields. In this chapter we explain diffraction using the wave nature of light and discuss several applications of diffraction in science and technology. 36-
Diffraction and the Wave Theory of Light Diffraction Pattern from a single narrow slit. Side or secondary maxima Light Central maximum These patterns cannot be explained using geometrical optics (Ch. 34)! Fresnel Bright Spot. Light Bright spot 36-
Fig. 36-4 Diffraction by a Single Slit: Locating the Minima When the path length difference between rays r1 and r2 is l/2, the two rays will be out of phase when they reach P1 on the screen, resulting in destructive interference at P1. The path length difference is the distance from the starting point of r2 at the center of the slit to point b. For D>>a, the path length difference between rays r1 and r2 is (a/2) sin q. 36-
Diffraction by a Single Slit: Locating the Minima, Cont'd (minima-dark fringes) Fig. 36-5 Repeat previous analysis for pairs of rays, each separated by a vertical distance of a/2 at the slit. Setting path length difference to l/2 for each pair of rays, we obtain the first dark fringes at: (first minimum) For second minimum, divide slit into 4 zones of equal widths a/4 (separation between pairs of rays). Destructive interference occurs when the path length difference for each pair is l/2. (second minimum) Dividing the slit into increasingly larger even numbers of zones, we can find higher order minima: 36-
Intensity in Single-Slit Diffraction, Qualitatively To obtain the locations of the minima, the slit was equally divided into N zones, each with width Dx. Each zone acts as a source of Huygens wavelets. Now these zones can be superimposed at the screen to obtain the intensity as function of q, the angle to the central axis. To find the net electric field Eq (intensity aEq2) at point P on the screen, we need the phase relationships among the wavelets arriving from different zones: N=18 1st side max. 1st min. q = 0 q small Fig. 36-6 36-
Fig. 36-7 Intensity in Single-Slit Diffraction, Quantitatively Here we will show that the intensity at the screen due to a single slit is: In Eq. 36-5, minima occur when: If we put this into Eq. 36-6 we find: 36-
Proof of Eqs. 36-5 and 36-6 Fig. 36-8 If we divide slit into infinitesimally wide zones Dx, the arc of the phasors approaches the arc of a circle. The length of the arc is Em. f is the difference in phase between the infinitesimal vectors at the left and right ends of the arc. fis also the angle between the 2 radii marked R. The dash line bisecting f forms two triangles, where: In radian measure: Solving the previous 2 equations for Eq one obtains: The intensity at the screen is therefore: f is related to the path length difference across the entire slit: 36-
Diffraction by a Circular Aperture a a Light Light q q Distant point source, e,g., star d Image is not a point, as expected from geometrical optics! Diffraction is responsible for this image pattern q lens 36-
Resolvability Fig. 36-10 Rayleigh’s Criterion: two point sources are barely resolvable if their angular separation qR results in the central maximum of the diffraction pattern of one source’s image is centered on the first minimum of the diffraction pattern of the other source’s image. 36-
Diffraction by a Double Slit Fig. 36-14 Double slit experiment described in Ch. 35 where assumed that the slit width a<<l. What if this is not the case? Two vanishingly narrow slits a<<l Single slit a~l Two Single slits a~l 36-
Diffraction Gratings Fig. 36-17 Fig. 36-18 Device with N slits (rulings) can be used to manipulate light, such as separate different wavelengths of light that are contained in a single beam. How does a diffraction grating affect monochromatic light? 36-
Width of Lines Fig. 36-20 Fig. 36-19 The ability of the diffraction grating to resolve (separate) different wavlength depends on the width of the lines (maxima) 36-
Width of Lines, cont’d Fig. 36-21 In this course, a sound wave is roughly defined as any longitudinal wave (particles moving along the direction of wave propagation). 36-
Grating Spectroscope Fig. 36-23 Fig. 36-22 Separates different wavelengths (colors) of light into distinct diffraction lines 36-
Optically Variable Graphics Fig. 36-25 Gratings embedded in device send out hundreds or even thousands of diffraction orders to produce virtual images that vary with viewing angle. Complicated to design and extremely difficult to counterfeit, so makes an excellent security graphic. 36-
Gratings: Dispersion and Resolving Power Dispersion: the angular spreading of different wavelengths by a grating Resolving Power 36-
Proof of Eq. 36-30 Angular position of maxima Differential of first equation (what change in angle does a change in wavelength produce?) For small angles 36-
Proof of Eq. 36-32 Rayleigh's criterion for half-width to resolve two lines Substituting for Dq in calculation on previous slide 36-
Dispersion and Resolving Power Compared Table 36-1 Grating Nd (nm) q D (o/mm) R A 10 000 2540 13.4o 23.2 10 000 B 20 000 2540 13.4o 23.2 20 000 C 10 000 1360 25.5o 46.3 10 000 Data are for l = 589 nm and m = 1 Fig. 36-26 In this course, a sound wave is roughly defined as any longitudinal wave (particles moving along the direction of wave propagation). 36-
X-Ray Diffraction Fig. 36-27 X-rays are electromagnetic radiation with wavelength ~1 Å = 10-10 m (visible light ~5.5x10⁻⁷ m) X-ray generation X-ray wavelengths to short to be resolved by a standard optical grating 36-
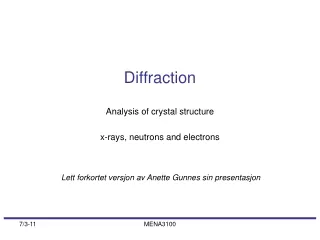
X-Ray Diffraction, cont’d Fig. 36-28 Diffraction of x-rays by crystal: spacing d of adjacent crystal planes on the order of 0.1 nm → three-dimensional diffraction grating with diffraction maxima along angles where reflections from different planes interfere constructively 36-
Fig. 36-29 X-Ray Diffraction, cont’d interplanar spacing d is relatedto the unit cell dimensaion a0 Not only can crystals be used to separate different x-ray wavelengths, but x-rays in turn can be used to study crystals, for example determine the type crystal ordering and a0 36-
hitt In a Young's double-slit experiment, the slit separation is doubled. This results in: A. an increase in fringe intensity B. a decrease in fringe intensity C. a halving of the wavelength D. a halving of the fringe spacing E. a doubling of the fringe spacing
hitt A light wave with an electric Field amplitude of E0 and a phase constant of zero is to be combined with one of the following waves: wave A has an amplitude of E0 and a phase constant of zero wave B has an amplitude of E0 and a phase constant of π wave C has an amplitude of 2E0 and a phase constant of zero wave D has an amplitude of 2E0 and a phase constant of π wave E has an amplitude of 3E0 and a phase constant of π Which of these combinations produces the greatest intensity?
The light waves represented by the three rays shown in the diagram all have the same frequency. 4.7 wavelengths fit into layer 1, 3.2 wavelengths fit into layer 2, and 5.3 wavelengths fit into layer 3. Rank the layers according to the speeds of the waves, least to greatest. A. 1, 2, 3 B. 2, 1, 3 C. 3, 2, 1 D. 3, 1, 2 E. 1, 3, 2 Layer 1 Layer 2 Layer 3
In a Young’s double-slit experiment, light of wavelength 500 nm illuminates two slits that are separated by 1mm. The separation between adjacent bright fringes on a screen 5m from the slits is: A. 0.10 cm B. 0.25 cm C. 0.50 cm D. 1.0 cm E. none of the above