Download
1 / 18
180 likes | 338 Vues
The Contribution of Marine Organic Emissions to Coastal Air Quality. Brett Gantt Advisor: Nicholas Meskhidze Co-Author: Annmarie Carlton (EPA) North Carolina State University 9th Annual CMAS Conference October 12, 2010. How Marine Organics get into the Atmosphere.

E N D
The Contribution of Marine Organic Emissions to Coastal Air Quality Brett Gantt Advisor: Nicholas Meskhidze Co-Author: Annmarie Carlton (EPA) North Carolina State University 9th Annual CMAS Conference October 12, 2010
How Marine Organics get into the Atmosphere Secondary organics associated phytoplankton BVOC emissions Primary organics associated with sea spray emissions Image created by SOLAS (http://solas-int.org/)
Why They Matter • Near productive oceans, the following have been observed: • High concentration of organic carbon aerosols (O’Dowd et al., 2004; Sciare et al., 2009) • New particle formation/growth (Vaattovaara et al., 2006) • Cloud microphysical changes (Meskhidze and Nenes, 2006) Meskhidze and Nenes (2006) O’Dowd et al. (2004) Sciare et al. (2009)
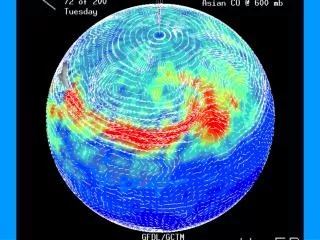
Observed Marine Boundary Layer Hydrocarbon Concentrations (ppt) (ppt) Shaw, Gantt, and Meskhidze (2010)
Recent Global Emission Inventories Marine Primary Organic Aerosols Poster in Emission Inventories Spracklen et al. (2008) Langmann et al. (2008) Long et al. (2010) Marine Isoprene Palmer and Shaw (2005) Gantt et al. (2009)
Our Marine Isoprene Emissions Gantt et al. (2009) Phytoplankton Speciation Chlorophyll-a Concentration 10 meter Winds Solar Radiation Diffuse Attenuation
Modeling Marine Isoprene and Air Quality Emission rate Isoprene Concentration Change SOA concentration change 8-hour max. O3 concentration change Gantt et al. (2010a)
Other Recent Marine Modeling Efforts Isoprene α-pinene (ppt) (ppt) Luo and Yu (2010) Luo and Yu (2010) Arnold et al. (2009) Total Organic Aerosols Primary Organic Aerosols SOA Myriokefalitakis et al. (2010) Vignati et al. (2009) Spracklen et al. (2008)
Marine Organic Aerosol Contribution • Up to 50% of surface organic carbon and 10% of PM2.5 (0.3 µg m-3) is composed of marine organics % change in organic carbon % change in PM2.5 Gantt et al. (2010b)
Impact of Marine Hydrocarbon Emissions • Graphs illustrate the “top down” emission rates derived from Southern Ocean • Only small changes in SOA and O3 occur • Marine SOA/Marine OA < 20% % change in O3 Increase in marine SOA Gantt et al. (2010b)
Comparison with Observations • Marine primary OC concentrations similar to IMRPOVE OC • Up to ~1 µg m-3 of marine OC is predicted Gantt et al. (2010b)
Some Important Unknowns • Global marine emission estimates differ immensely • Factor of 30 difference for isoprene and 2000 for α-pinene (Luo and Yu, 2010) • Factor of 10 difference for primary organic aerosols • Impacts of other gases • DMS, Amines, Halocarbons • See Smith and Mueller (2010) for additional discussion • Factors affecting the organic fraction of sea spray Gantt and Meskhidze (submitted) O’Dowd et al. (2008)
What’s Next • Extensive lab measurements for phytoplankton-emitted biogenic hydrocarbons and organic aerosols from bubble bursting under different environmental conditions • Recently, our lab has… • Measured ~25 different VOCs emitted from phytoplankton • Measured aerosol size/composition from bubble-bursting • Additional modeling studies looking into the impact of marine organics on climate and global air quality
organic fraction size distribution + number conc. CCN number vs. supersaturation mixing state Experimental Set-up filtered air CPC dryer+ neutralizer DMA CCN Instrument Tiny amount: 1/10000000 makes a very large difference in aerosol chemical properties optical bubble sizing 55 cm Flow rate: bubble number flux Diffuser porosity: bubble size variable injection depth DMA: differential mobility analyzer CPC: condensation particle counter CCN: cloud condensation nuclei Rectangular bubble tank
Thanks for your attention and the opportunity to speak Any questions???
Increase in PM2.5 from marine organics Gantt et al. (2010b)