Download
1 / 22
220 likes | 236 Vues
This study evaluates road effects on water processes, habitat, and pollution in Puerto Rico, using Geographic Information System data to examine road and stream network connectivity. Findings inform on bridge scour, fish barriers, and stream connectivity for adult fish.

E N D
Physical Road and Stream Network Connectivity: Northeastern Puerto Rico Kirk Sherrill1, A. Pike, M. Laituri, F. Scatena, K. Hein, F. Blanco 1Dept. of Forest, Rangeland and Watershed Stewardship, Colorado State University Hydrology Days March, 20th 2006
Introduction • Roads have an undeniable presence throughout most terrestrial landscapes • 5,000,000 mile road network in North America • 250,000,000 vehicles in North America • Numerous Roads Effect A. Pollution (ie. Road dust, Ambient Noise, Salt, Nitrogen, CO2) B. Habitat Loss and Degradation (ie. Fragmentation, increased human access, noxious species, altered disturbance regimes etc.) • Water Processes
C. Water Processes • Roads act as increased sources for water and sediment movement • Roads act as barriers to water, sediment and aquatic species movement • Altered stream and sediment flow are the most important road effects regarding Road and Stream network connectivity (R/S Connectivity)(Forman and Alexander 1998, Gibson et al. 2005, Lugo and Gucinski 2000, Montgomery 1994, Roth et al. 1996, Walker et al. 1995, and Wemple et al. 1996).
R/S Connectivity • Road and Stream Network Connectivity (R/S Connectivity) • Degree by which interactions affect ecosystem process: • Physical R/S Connectivity - Occurs from direct contact between roads and streams usually at crossing structures
Measure Physical R/S Connectivity by: I. Performing a localized Bridge Scour Survey II. Evaluate Steam Network Connectivity For Fish Determine utility of using Geographic Information System (GIS) derived data to: (I) Model bridge scour (II) Identify of road crossings which are fish barriers Objectives
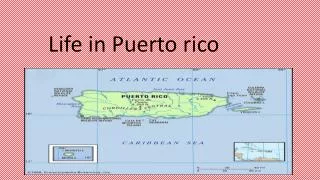
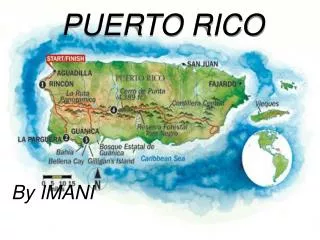
Study area and Sample sites Puerto Rico PuertoRico PuertoRico • 24 River Road Crossings (RRC) Study Sites • Rio Espiritu (~ 23,500 acres) • Rio Mameyes (~11,000 acres) • Northeastern Puerto Rico • Caribbean National Forest • Sea Level to 3,500 feet
Methods • I. Bridge Scour Survey (Johnson et al. 1999) was performed at 24 RRC • Evaluated Scour Scores relative: • Environmental Variables (Land Cover, Geology, Elevation, Stream Power) • Road Characteristics (Stream Size, Road Size, Crossing Type, % Stream Constriction) • Model Scour Scores
Bridge Scour Survey • Amount of or potential for alteration to Sediment and Stream Flow in vicinity of RRC • 11 Indicator Variables • Rated (1-12) • Weighted • Summed Final Scour Rating
Relative Categorical Scour Ratings Sites 6 Stable 8 Moderate 5 Poor 5 Unstable
I. Scour By Environmental Variables Two Scales of Study: -Local 250 meter circular buffer -Broad Upstream contributing area
I. Scour Rating By Environmental Variables • Average Unit Stream Power • Land Cover • Underlying Geology • Average Elevation • Characteristics of Stable Scour Site?
I. Scour Rating By Stream Power • Stable Scour Sites: • Average Unit Stream Power: Not Significant Stream Power Data Collected by(Pike and Scatena in press)
I. Scour Rating By Average Elevation • Stable Scour Sites: • Significantly Higher Elevations (ANOVA α=0.05, P-Value <.01)
I. Scour Rating By Land Cover • Land Cover (Ramos Gonzalez 2001) • (Forest, Agriculture, and Urban) • Stable Scour Sites: • Buf Scale 6/6 Stable Sites • 100% Forested Land Cover • 100% Extrusive Geology • Ups Scale 5/6 Stable Sites • 100% Forested Land Cover • Ups Scale 4/6 Stable Sites • 4/6 100% Extrusive Geology
I. Scour Rating By Road Characteristics • Stream Size • Road Size • Percent Stream Constriction No Significant Trend
I. Scour Rating By Crossing Type • Significant (ANOVA α=0.05, P-Value <.01) • Bridge Crossings Lower Scour Scores
I. Modeling Bridge Scour • Best Model Stepwise Selection • Alluvial Geology Buffer scale (+10.85) • Crossing Type (1=Culvert, 2= Bridge) (-9.94) • Stream Size (1=Large, 2=Medium, 3=small) (-3.96) • R2 = 0.65
II. Stream Network Connectivity for Adult Fish • Method 1. GIS Stream Slope Analysis (10m resolution) • 3x3 Kernel and Minimum Statistic • First Stream Segments >30% Slope = First natural occurring fish barrier on stream network 2. Field Data noting potential barrier crossings • 6 Crossing possible barriers 3. Verify Accuracy of Field Data and Stream Slope • Adult Fish Species Richness data (Hein et al.) • Findings • Stream Slope correctly identified 21/24 RRC relative to 1st natural fish barrier • Only 2 RRC acting as Fish Barriers or Partial Fish barriers • Both Culverts
Conclusions • GIS can be used to: • Model Scour • Locate Crossing location relative to 1st Fish Barrier • GIS Limitations? • Important variables require field data collection • Extensive Biological Field Data is needed to Identify Barrier Crossings
Conclusions • Low Physical R/S Connectivity Sites: • High Proportions Forest and Extrusive Geology • Higher Elevations • Bridge Crossing • Lower Scour Scores and less likely to be fish barriers • Prieta, and Bisley sites (Both 100% Forest and 100% Extrusive, at high elevation but Culvert Crossings Poor Scour Score • Crossing Type most important?
Acknowledgements • NSF grant DEB-0308414 NE Puerto Rico Biocomplexity projecthttp://biocomplexity.warnercnr.colostate.edu. • Andy Pike and Fred Scatena, Dept. of Earth and Environmental Sciences, University of Pennsylvania, Philadelphia, PA. • Melinda Laituri, Dept. of Forest, Rangeland and Watershed Stewardship, Colorado State University, Fort Collins, CO. • Katie Hein and Felipe Blanco, Dept. of Aquatic, Watershed and Earth Resources, Utah State University, Logan, UT.
Thank You&Questions? Thank You & Questions?