Optimal Demand Allocation Model for Logistics Efficiency
Explore allocation strategies to minimize costs and maximize efficiency in distributing goods from two plants to three markets through warehouses. Analyze different approaches to optimize supply chain logistics.

Optimal Demand Allocation Model for Logistics Efficiency
E N D
Presentation Transcript
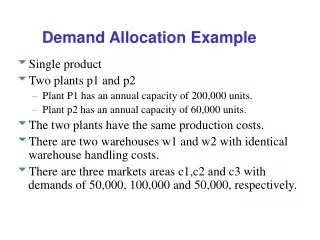
Demand Allocation Example • Single product • Two plants p1 and p2 • Plant P1 has an annual capacity of 200,000 units. • Plant p2 has an annual capacity of 60,000 units. • The two plants have the same production costs. • There are two warehouses w1 and w2 with identical warehouse handling costs. • There are three markets areas c1,c2 and c3 with demands of 50,000, 100,000 and 50,000, respectively.
Example: Distribution Network $0 D = 50,000 $3 Cap = 200,000 $4 $6 $5 D = 100,000 $2 $4 $1 $2 Cap = 60,000 $2 D = 50,000 Production costs are the same, warehousing costs are the same
Traditional Approach #1:Assign each market to closest WH. Then assign each plant based on cost. D = 50,000 Cap = 200,000 $5 x 140,000 D = 100,000 $2 x 50,000 $1 x 100,000 $2 x 60,000 Cap = 60,000 $2 x 50,000 D = 50,000 Total Costs = $1,120,000
Traditional Approach #2:Assign each market based on total landed cost $0 D = 50,000 $3 Cap = 200,000 P1 to WH1 $3 P1 to WH2 $7 P2 to WH1 $7 P2 to WH 2 $4 $4 $6 $5 D = 100,000 $2 P1 to WH1 $4 P1 to WH2 $6 P2 to WH1 $8 P2 to WH 2 $3 $4 $1 $2 Cap = 60,000 $2 D = 50,000 P1 to WH1 $6 P1 to WH2 $7 P2 to WH1 $10 P2 to WH 2 $4
Traditional Approach #2:Assign each market based on total landed cost $0 D = 50,000 $3 Cap = 200,000 P1 to WH1 $3 P1 to WH2 $7 P2 to WH1 $7 P2 to WH 2 $4 $4 $6 $5 D = 100,000 $2 P1 to WH1 $4 P1 to WH2 $6 P2 to WH1 $8 P2 to WH 2 $3 $4 $1 $2 Cap = 60,000 $2 D = 50,000 P1 to WH1 $6 P1 to WH2 $7 P2 to WH1 $10 P2 to WH 2 $4 Market #1 is served by WH1, Markets 2 and 3 are served by WH2
Traditional Approach #2:Assign each market based on total landed cost $0 x 50,000 D = 50,000 $3 x 50,000 Cap = 200,000 P1 to WH1 $3 P1 to WH2 $7 P2 to WH1 $7 P2 to WH 2 $4 $5 x 90,000 D = 100,000 P1 to WH1 $4 P1 to WH2 $6 P2 to WH1 $8 P2 to WH 2 $3 $1 x 100,000 $2 x 60,000 Cap = 60,000 $2 x 50,000 D = 50,000 P1 to WH1 $6 P1 to WH2 $7 P2 to WH1 $10 P2 to WH 2 $4 Total Cost = $920,000
Which market is served by which plant? Which supply sources are used by a plant? xij = Quantity shipped from plant site i to customer j Demand Allocation Model 5-10
The Optimal Strategy Table 2 Distribution strategy Facility P1 P2 C1 C2 C3 Warehouse W1 140000 0 50000 90000 0 W2 0 60000 0 10000 50000 The total cost for the optimal strategy is 740,000.
A real example:much more complex problem, the current Network Inbound: $ 851,000 Outbound: $ 2,930,000 Inv Cost: $13,291,000 WH Fixed: $ 1,875,000 Total: $18,947,000
A real example:Optimal Network Inbound: $ 783,000 Outbound: $ 5,900,000 Inv Cost: $ 7,679,000 WH Fixed: $ 625,000 Total: $14,987,000 $4 Million Savings