Download
1 / 53
530 likes | 634 Vues
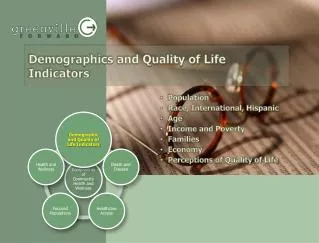
Demographics and Quality of Life Indicators. Population Race, International, Hispanic Age Income and Poverty Families Economy Perceptions of Quality of Life. The study focused on five primary emphasis areas.

E N D
Demographics and Quality of Life Indicators • Population • Race, International, Hispanic • Age • Income and Poverty • Families • Economy • Perceptions of Quality of Life
The study focused on five primary emphasis areas. While we explored all components of the emphasis areas, this report looks at the most compelling. Complete analysis of all areas are available on www.greenvilleforward.com. • Population • Education • Household income • Economic Climate • Recreation Infrastructure Secondary Data Scan • Obesity • Nutrition • Exercise • Substance Abuse • Family Abuse • Teen Pregnancy • Disease rates • Death rates • Infant Mortality • Cancer • Insurance/Uninsured • Healthcare Spending • Medicaid Spending • Medicare Spending • Healthcare Policy • Facilities • Uninsured • Low income • Hispanic • Neighborhood
Greenville remains the #1 most populous county in South Carolina, and is growing. 427,770 275,879 Population 355,181 251,164 246,600 336,819 Source: Claritas, US Census Bureau
Population growth 1990 to 2008 30% or more 20% to 30% 10% to 20% Less than 10% Greenville is the ninth fastest growing county in the state. 34% 59% Population 74% 34% 70% 70% Source: Claritas, US Census Bureau
Greenville’s population has grown over 34% in 17 years. Population Source: Claritas, 2007
The population is growing to the southeast. 75% of the county’s population now live outside the traditional downtown geographies. 2013 Population Source: Claritas 2008
…growing slightly faster than South Carolina, expecting to reach 500,000 in the next ten years. Greenville28% growth Population Source: South Carolina Office of Research and Statistics, U.S. Census Bureau, 2001 Supplemental Survey
Since 1998, Greenville is growing. Population Growing Population
The population is growing to the southeast. 75% of the county’s population now live outside the traditional downtown geographies. 1990 2008 Population Source: Claritas 2008
The population is growing to the southeast. 75% of the county’s population now live outside the traditional downtown geographies. 2013 Population Source: Claritas 2008
The population is growing to the southeast. 75% of the county’s population now live outside the traditional downtown geographies. 2013 Population Source: Claritas 2008
Greenville’s population is predominantly white, yet other groups are growing rapidly. Race Greenville is much “whiter” than the state (75% compared to 67%). Source: Claritas 2008
Greenville County is highly segregated. Race Source: Claritas 2008
The foreign born population is becoming a more visible force… with the last decade showing the largest growth in history. • Greenville’s foreign born population in 2001 was 18,420, 5% of the total population. This is a growth of over 300% from the 6,000 residents in 1990. • Greenville and South Carolina are still below the national average on the number of foreign born of 11%. South Carolina ranks 39th out of the 50 states. Race Source: South Carolina Office of Research and Statistics, U.S. Census Bureau, 2001 Supplemental SurveyAmerican Community Survey
English is not the primary language in 7% of Greenville’s households. International Over 33,000 Greenvillians speak a language other than English in their homes. Source: American Community Survey, 2003
Key Findings: Changing Demographics • Access to health care has improved in Greenville County; but some people are not receiving care. • Greenville’s medically underserved population is growing. • Health lifestyles are important in preventing chronic illnesses, yet people continue to lead unhealthy lives and act in unhealthy ways. • Rapid growth in the senior and Hispanic populations generate unique challenges. • Substance abuse and mental health services are areas that need focus. • Continued problems with transportation.
1990 % Hispanic Population The Hispanic population in 1990 was relatively non-existent. Only one census tract had more than 2% of its population with Hispanic origin. Hispanic Source: Claritas, 2001 Source: Claritas, 2008
2008 % Hispanic Population The Hispanic population in the county has grown over 400% in the last ten years. Since 1990, the reported Hispanic population has grown from less than 3,000 to over 28,273. Hispanic Now, several census tracts have in excess of 15% Hispanic populations. Source: Claritas, 2008
By 2013, the Hispanic population is expected to grow to over 41,000, 12 times the 1990 population. Hispanic In Greenville County the Hispanic population is 7% and is expected to grow to 9% by 2013. 1274% Growth Source: Claritas, 2008
The Hispanic population is concentrated in small areas. Hispanic Population 2008 Hispanic Source: Claritas, 2008
Greenville’s Hispanic population is exploding; faster than the state and nation. Hispanic Source: Claritas, 2008
Health System Challenges: The majority of births to Hispanic mothers are covered under Medicaid(Births at Greenville Memorial Hospital and Allen Bennett Memorial Hospital) Hispanic In contrast, 42% of children in Greenville County are served by Medicaid and the State’s Children’s Health Insurance Program. Source: Greenville County Health Department; DHEC Birth Cretificate Data
Births to Hispanic mothers in local hospitals has more the doubled since the 1998 study—from 4% of births to over 10%. Hispanic Source: Greenville County Health Department
Greenville’s population is aging; yet also experiencing a small baby boomlet. • By 2006, 24% of the population will be over age 55, up from 21% in 1990. • The baby “boomlet” is also apparent with the increase of those under age 24. Age Source: Claritas
Starting at 2000, we can show the change in population. 2000 Age Source: Claritas
Starting at 2000, we can show the change in population. 2019 Age Source: Claritas
The elderly population AND those under 25 are growing faster than the United States. Age Source: Claritas
Our elderly and youngest population is growing. Age Source: Claritas
Seniors have some key concerns. • How to provide health care infrastructure • How to pay for healthcare • Increasing debt, credit card debts, mortgages • Availability of affordable housing • Ability for Medicare and social security to pay out • Retirement, lesser pension plans, ability to find part time work • Special needs individuals • Caregiver needs Health and Wellness Source: Center for Disease Control and SC Mature Adults Count
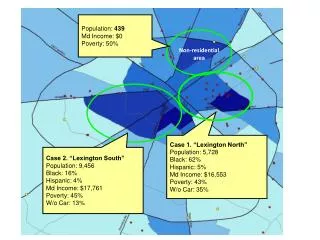
What is Poverty? Who does it affect? • The estimated number of people in Greenville County currently living below the poverty level is 58,176, up from 45,900 in 2000. This is an increase of 26% in eight years. • In Greenville County, 20,307 (20%) of children under the age of 18 live below poverty. This is an increase of 55% from 13,073 in 2000. • 5,585 (11%) of people age 65 and over live below poverty. Income and Poverty Poverty is increasing dramatically in Greenville County. American Community Survey 2006
Almost one-third of single mothers live in poverty. Income and Poverty Source: Claritas 2008
Poverty Status Income and Poverty Source: Claritas, 2008
Poverty Status Income and Poverty Source: Claritas, 2008
Income distribution is diverse and spread throughout the county. Income and Poverty Source: US Census Bureau 2000, Claritas 2006 projections
Income distribution is diverse and spread throughout the county. Income and Poverty Parkins Mill $138,000 Average HH Income City View $33,159 Average HH Income The median household income in the county is $50,332. This is higher than South Carolina at $44,227 and the U.S. at $50,046. Source: US Census Bureau 2000, Claritas 2006 projections
Some of the lowest income census tracts are directly adjacent to the highest income census tracts. Income and Poverty Source: US Census Bureau 2000, Claritas 2006 projections
We should continue to focus on areas of high poverty, taking services to the places of greatest need. Update Income and Poverty 14% of our children live in poverty. Among subgroups, 28% of Hispanic children and 29% of African American children live in poverty.
Areas with the Greatest Level of No High School Diploma, 2001 28% of Greenvillians do not have a high school diploma. Update Education Source: US Census Bureau 2000, Claritas 2001 projections
28% of children live in a single parent household. Update Fathers are becoming increasingly absent in the home. The percent of children living in single parent families has gone from 12% in 1970 to 28% in 2001. Families Source: Claritas, 2002
One in four children lives in a single parent household. Update Families 49% of families living in poverty are single mothers with children. Source: Claritas, 2008
Family dynamics are changing… Update • 28% of children live in a single parent households, up from 12% in 1970. • Half of households living in poverty are single mother households with children under age 18. • While only 4% of children living in two parent households live in poverty, 31% of children living in single mother households live in poverty. • In 1960, a little over one in three moms with children under age six worked. Now, over 65% of Greenville mothers work, putting additional pressures on the household. Families
Births to single mothers is especially high among minority households. Update Families Source: Greenville County Kids Count, 2002
Half of the households in Greenville that live in poverty are headed by single mothers with children under the age of 18. Update Families Source: Claritas, 2002
Since 1998, Greenville’s economy is changing. Update Economy Challenging Economy
The Income Gap is widening. Economy
83% of Greenvillians say Greenville is a good place to live; higher than in previous years. Quality of Life 1. How would you rate Greenville as a place to live?
How Do Residents Say Greenville County Performs? Quality of Life % saying “very good” or “outstanding” How would you rate Greenville County on each of the following issues? Use a 1 to 5 scale, with 1 being “Poor” and 5 being “Outstanding.”
How Do Residents Say Greenville County Performs? • Highest Score • Good place to raise children • Healthcare convenient to your home • Cleanliness of air and water • Quality healthcare • Recreational facilities Quality of Life • Lowest Score • Ability to get places without a car • Homelessness • Spousal or child abuse • Affordable healthcare • Level of drug and alcohol abuse % saying “very good” or “outstanding” How would you rate Greenville County on each of the following issues? Use a 1 to 5 scale, with 1 being “Poor” and 5 being “Outstanding.”