1 / 1

Neighborhood Disparities in Lexington, USA

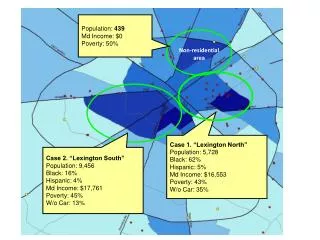
A comparative study of socioeconomic indicators in two areas of Lexington, North and South, reveals significant disparities in population demographics, income levels, poverty rates, and access to transportation.

edric
Télécharger la présentation

Neighborhood Disparities in Lexington, USA

An Image/Link below is provided (as is) to download presentation Download Policy: Content on the Website is provided to you AS IS for your information and personal use and may not be sold / licensed / shared on other websites without getting consent from its author. Content is provided to you AS IS for your information and personal use only. Download presentation by click this link. While downloading, if for some reason you are not able to download a presentation, the publisher may have deleted the file from their server. During download, if you can't get a presentation, the file might be deleted by the publisher.

E N D

Presentation Transcript


  1. Population: 439 MdIncome: $0 Poverty: 50% Non-residential area Case 1. “Lexington North” Population: 5,728 Black: 62% Hispanic: 5% Md Income: $16,553 Poverty: 43% W/o Car: 35% Case 2. “Lexington South” Population: 9,456 Black: 16% Hispanic: 4% Md Income: $17,761 Poverty: 45% W/o Car: 13%

More Related