Download
1 / 18
180 likes | 198 Vues
Explore alternative policies for nutrient control in the UMRB dominated by agriculture; integrated economic and water quality modeling; assess conservation practices' impacts; analyze policy scenarios and cost-benefit ratios. Future steps include wetlands conservation.

E N D
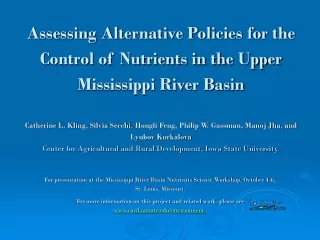
Assessing Alternative Policies for the Control of Nutrients in the Upper Mississippi River BasinCatherine L. Kling, Silvia Secchi, Hongli Feng, Philip W. Gassman, Manoj Jha, and Lyubov KurkalovaCenter for Agricultural and Rural Development, Iowa State University. For presentation at the Mississippi River Basin Nutrients Science Workshop, October 4-6, St. Louis, Missouri. For more information on this project and related work, please see www.card.iastate.edu/environment.
“What that Mud in Our Rivers Adds up to Each Year” Ding Darling, 1946
The UMRB • 189,000 square miles in seven states, • dominated by agriculture: 67% of total area, • > 1200 stream segments and lakes on impaired list, • Primarily nutrients (esp. phosphorous) & sediment, • Multiple conservation practices can ameliorate (Land retirement, tillage, grassed waterways, contours, terraces, etc.)
Integrated Economic, Land use, and Water Quality Model for the UMRB • Couple large-scale, spatially-detailed watershed model with economic model to study costs and water quality changes of conservation policy • Focus on agricultural land use decisions – cropland • Use NRI as basis for both economics and watershed model • Purpose of modeling system is to provide policy level information • Consider both upstream water quality (within the UMRB), and downstream effects (Gulf of Mexico)
Outline • Intro to Watershed/water quality model • Intro to Economic model • Policy Scenario description • Results of Preliminary Analysis • Direction for future
I. The Water Quality model: Soil and Water Assessment Tool (SWAT) • SWAT is watershed based: predicts changes in environmental quality at watershed outlets, highly nonlinear between practices, land characteristics, soil types, and water quality • Features • simulates a high level of spatial detail, operates on a daily time-step • calibrated to observed water quality and quantity data • can/has been used in both regional analyses and small-scale studies • Key data sources, flow calibration, see poster
7100 7010 7020 7030 7050 7070 7090 7120 7140 7040 7060 7080 7130 7110 Grafton Watershed Schematic
Upper Mississippi River Basin Baseline - Pollution Loadingsa • Loads are measured in thousand of tons, 18 year averages.
II. Economic Models and Cost Information • Adoption model to estimate returns to conservation tillage 1. Specification, Estimation, and Prediction Samples (Kurkalova) 2. Separate model for each 8-digit HUC (14 models) 110,000 total NRI “points” and expansion factors, over 37,500 cropland points • Other data sources: 1992 and 1997 NRI data (soil and tillage), Census of Agriculture (farmer characteristics), Climate data of NCDC, Conservation tillage data from CTIC, Cropping Practices Surveys (budgets), cash rental rates • Cash rental rate as a function of yields to estimate opportunity cost of land retirement, vary by county and state • Costs of Buffers, Grassed Waterways, Terraces, Contours, and Nutrient Management from various sources and expert opinion (Iowa DNR)
III. Policy Scenarios • What are the costs of implementing a broad set of conservation practices that focus on sediments and phosphorous? • What are the local water quality gains? • What are the effects for the Gulf? • How much additional reduction in N flows occur from an across the board reduction of 10% N applications to corn production?
Implementation: Local Policy: “Sound Conservation Practices” • Step 1. Land Retirement. Retire all cropland within (<=) 100 ft. of a waterway, retire additional land to reach 10% total based on erosion index, • Step 2. Terraces. Terrace all remaining land with slope above 7%, • Step 3. Contours. Contour all remaining cropland with slopes above 4%, • Step 4. Grassed Waterways (GW). Place GWs on all remaining land with slopes of 2% or greater, • Step 5. Conservation/no till. For all cropland with slopes of 2% or greater not already in conservation tillage, place 20% of each watershed in no till and 80% in conservation tillage.
IV. RESULTS Sound Conservation Practices Implementation: Acreage and Costs
Sound Conservation Practices Implementation: Percentage gains in water quality
Additional N Control • SCP yields 7% reduction at Grafton • Targets: • Gulf Hypoxia Task Force set of 30% N decrease to meet (2001) • Scabia, et al (2003) suggest 40% may be needed to hit goal • Wetlands likely to be important part of solution, omitted here • Consider 10% N application reduction
Next Steps • Calibrate SWAT to nutrients • Most cost-effective conservation practice combinations • Targeting of watersheds (costs and water quality) • Trading programs • Longer term: wetlands

![[ F] [Bb] [F] Oh, [F] where have you been, my [Bb] blue-eyed [F] son? And [F] where have you been, my darling yo](https://cdn1.slideserve.com/1550086/slide1-dt.jpg)